
用 Python 可視化神器 Plotly 動(dòng)態(tài)演示全球疫情變化趨勢(shì)
“
閱讀本文大概需要 9 分鐘。
數(shù)據(jù)來(lái)源
國(guó)內(nèi)的疫情,目前已逐步受到控制,各項(xiàng)指標(biāo)已開(kāi)始明顯好轉(zhuǎn),但國(guó)外的情況,看起來(lái)不是太樂(lè)觀,已有的作業(yè)也沒(méi)有抄好,所以,本次我們主要來(lái)可視化分析國(guó)外疫情的發(fā)展情況。疫情的數(shù)據(jù)來(lái)源于開(kāi)源項(xiàng)目 Akshare,由于使用該項(xiàng)目獲取數(shù)據(jù)時(shí),有時(shí)不太穩(wěn)定,可能會(huì)遇到連接失敗的情況。準(zhǔn)備工作
照例,還是先介紹下我運(yùn)行的環(huán)境Mac 系統(tǒng)
Anaconda(Python 3.7)
Jupyter Notebook
import akshare as akimport pandas as pdimport plotlyfrom plotly.offline import iplot, init_notebook_modeimport plotly.express as pxfrom datetime import datetimeinit_notebook_mode()
# 從 akshare 獲取數(shù)據(jù)# df_all_history = ak.epidemic_history()# 從csv文件獲取數(shù)據(jù)df_all_history = pd.read_csv('epidemic_all_20200307.csv',index_col=0)df_all_history
['date']),一列是字符串格式的日期 (?['dates'])。這樣設(shè)置的原因,是因?yàn)槲覀兒罄m(xù)分別需要用到這兩種格式的日期。df_all = df_all_history# 將字符串格式的日期 另保存為一列df_all['dates'] = df_all_history['date']# 將字符串格式的日期轉(zhuǎn)換為 日期格式df_all['date'] = pd.to_datetime(df_all['date'])
獲取國(guó)外的疫情數(shù)據(jù)
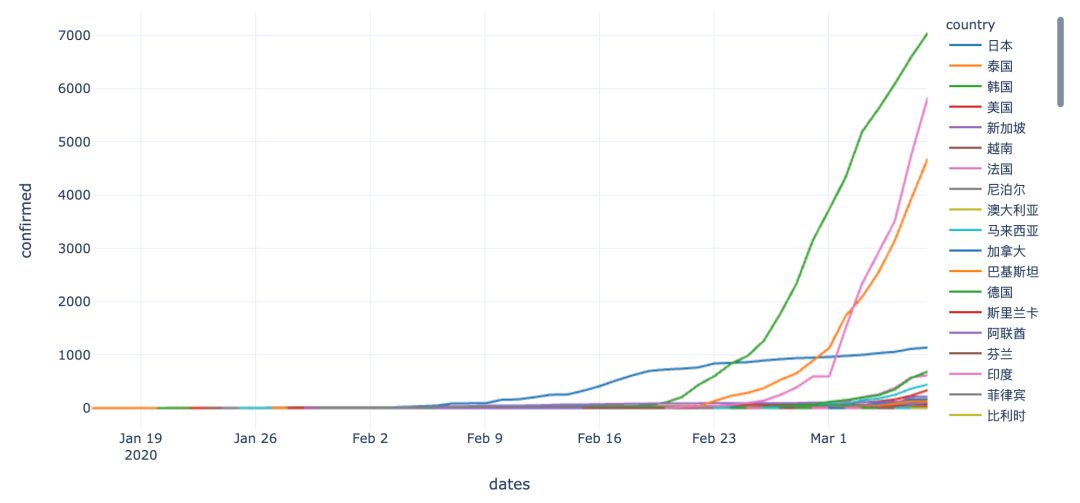
上面的數(shù)據(jù),是全球的數(shù)據(jù),我們可以把其中屬于中國(guó)的剔除,就可以得到國(guó)外的數(shù)據(jù)了。# 國(guó)外,按國(guó)家統(tǒng)計(jì)df_oversea = df_all.query("country!='中國(guó)'")df_oversea.fillna(value="", inplace=True)df_oversea
fig_oversea = px.line(df_oversea, x='dates', y='confirmed',line_group='country',color='country',color_discrete_sequence=px.colors.qualitative.D3,hover_name='country',)fig_oversea.show()
# 現(xiàn)有數(shù)據(jù)演示從 2020年2月10日開(kāi)始df_oversea_recent = df_oversea.set_index('date')df_oversea_recent = df_oversea_recent['2020-02-10':]df_oversea_recent
# 由于部分國(guó)家,數(shù)據(jù)不是從2020年2月10日開(kāi)始的,所以要補(bǔ)充數(shù)據(jù),數(shù)值為 0# 數(shù)據(jù)在 excel 表格中進(jìn)行補(bǔ)充,這里進(jìn)行讀取df_oversea_buchong = pd.read_excel('epidemic_buchong.xlsx')df_oversea_buchong['dates'] = df_oversea_buchong['date'].apply(lambda x:x.strftime('%Y-%m-%d'))df_oversea_buchong.set_index('date', inplace=True)df_oversea_buchong.fillna(value="", inplace=True)print(df_oversea_buchong.info())df_oversea_buchong
# 合并補(bǔ)充數(shù)據(jù)df_oversea_recent_new = df_oversea_recent.append(df_oversea_buchong)df_oversea_recent_new.sort_index(inplace=True)df_oversea_recent_new
# -*- coding: utf-8 -*-"""@Author: Lemonbit@出品:Python數(shù)據(jù)之道@Homepage: liyangbit.com"""fig_oversea_recent = px.scatter(df_oversea_recent_new, x='dead', y='confirmed',size='confirmed', text='country', color='country',color_discrete_sequence=px.colors.qualitative.Light24,animation_frame='dates',animation_group='country',hover_name='country',range_x=[-10,260],range_y=[0,8000],size_max=50,template='plotly_white',)fig_oversea_recent.show()
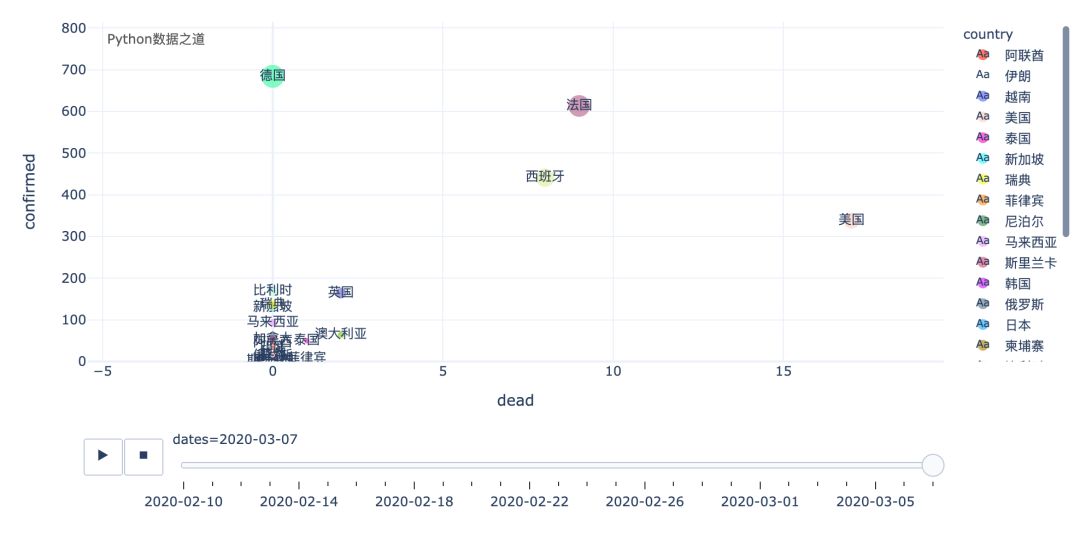
這里,還有一個(gè)國(guó)家,就是美國(guó),雖然從數(shù)據(jù)以及增長(zhǎng)情況來(lái)看,好像美國(guó)還好,但恐怕實(shí)際情況,要糟糕很多。上面是以氣泡圖的方式來(lái)演示變化過(guò)程,我們也可以以柱狀圖的形式來(lái)演示,效果如下:
需要說(shuō)明的是,本文代碼是在 Jupyter Notebook 中運(yùn)行的, 如果是在 PyCharm 等 IDE 中運(yùn)行,需要稍微修改下代碼。
推薦閱讀
1
2
別再造假數(shù)據(jù)了,來(lái)試試 Faker 這個(gè)庫(kù)吧!
3
200 行代碼實(shí)現(xiàn)一個(gè)滑動(dòng)驗(yàn)證碼
4??
如何用一條命令將網(wǎng)頁(yè)轉(zhuǎn)成電腦 App