<kbd id="afajh"><form id="afajh"></form></kbd>
<strong id="afajh"><dl id="afajh"></dl></strong>
    <del id="afajh"><form id="afajh"></form></del>
        1. <th id="afajh"><progress id="afajh"></progress></th>
          <b id="afajh"><abbr id="afajh"></abbr></b>
          <th id="afajh"><progress id="afajh"></progress></th>

          一行代碼讓matplotlib圖表變高大上

          共 5520字,需瀏覽 12分鐘

           ·

          2021-08-09 22:10


          導讀:懶人數(shù)據(jù)可視化必備。


          作者:費弗里
          來源:Python大數(shù)據(jù)分析(ID:pydatas)


          01 簡介

          matplotlib作為Python生態(tài)中最流行的數(shù)據(jù)可視化框架,雖然功能非常強大,但默認樣式比較簡陋,想要制作具有簡潔商務風格的圖表往往需要編寫眾多的代碼來調(diào)整各種參數(shù)。

          而今天要為大家介紹的dufte,就是用來通過簡短的代碼,對默認的matplotlib圖表樣式進行自動改造的Python庫:


          02 利用dufte自動改造matplotlib圖表


          通過pip install dufte安裝完成后,我們就可以將dufte的幾個關(guān)鍵API穿插在常規(guī)matplotlib圖表的繪制過程中,目前主要有以下幾種功能:

          1. 主題設置


          dufte最重要的功能是其自帶的主題風格,而在matplotlib中有兩種設置主題的方式,一種是利用plt.style.use(主題)來全局設置,一般不建議這種方式。

          另一種方式則是以下列方式來在with的作用范圍內(nèi)局部使用主題:

          # 局部主題設置
          with plt.style.context(主題):
              # 繪圖代碼
              ...

          我們今天就都使用第二種方式,首先導入演示所需的依賴庫,并從本地注冊思源宋體

          import dufte
          import numpy as np
          import matplotlib.pyplot as plt
          from matplotlib import font_manager

          # 注冊本地思源宋體
          fontproperties = font_manager.FontProperties(fname='NotoSerifSC-Regular.otf')

          接下來我們以折線圖和柱狀圖為例:

          • 折線圖

          # 折線圖示例
          with plt.style.context(dufte.style):
              x = range(100)
              y = np.random.standard_normal(100).cumsum()

              fig, ax = plt.subplots(figsize=(105), facecolor='white', edgecolor='white')

              ax.plot(x, y, linestyle='-.', color='#607d8b')

              ax.set_xlabel('x軸示例', fontproperties=fontproperties, fontsize=16)
              ax.set_ylabel('y軸示例', fontproperties=fontproperties, fontsize=16)

              ax.set_title('折線圖示例', fontproperties=fontproperties, fontsize=20)

              fig.savefig('圖2.png', dpi=300, bbox_inches='tight')
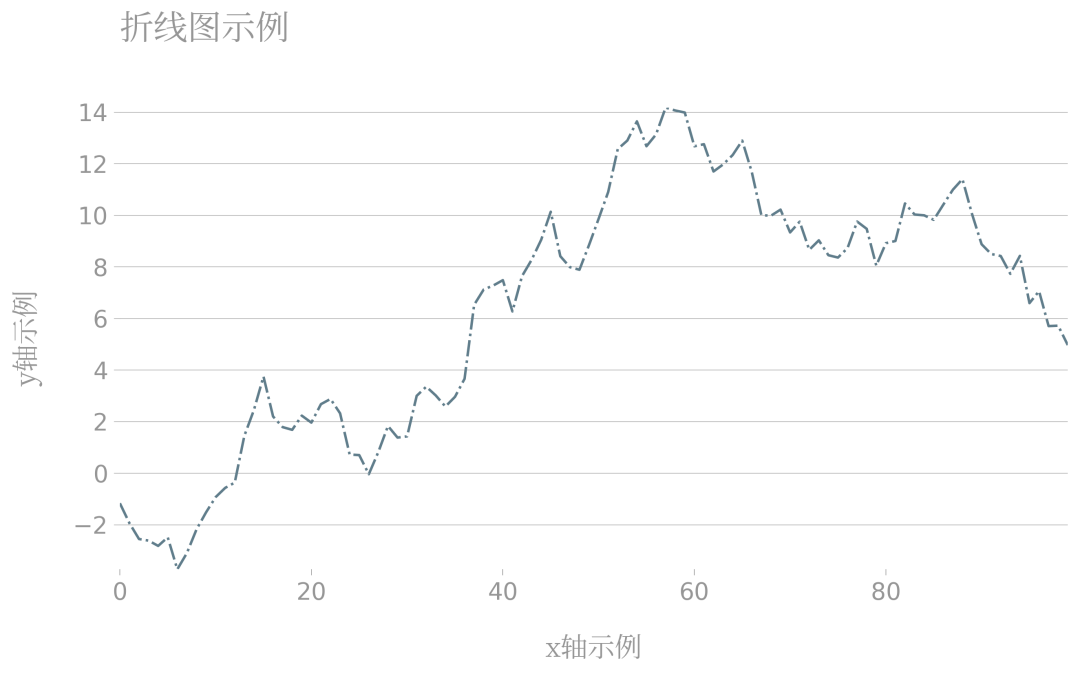

          • 柱狀圖

          # 柱狀圖示例
          with plt.style.context(dufte.style):
              x = range(25)
              y = np.random.standard_normal(25)

              fig, ax = plt.subplots(figsize=(105), facecolor='white', edgecolor='white')

              ax.bar(x, y)

              ax.set_xlabel('x軸示例', fontproperties=fontproperties, fontsize=16)
              ax.set_ylabel('y軸示例', fontproperties=fontproperties, fontsize=16)

              ax.set_title('柱狀圖示例', fontproperties=fontproperties, fontsize=20)

              fig.savefig('圖3.png', dpi=300, bbox_inches='tight')
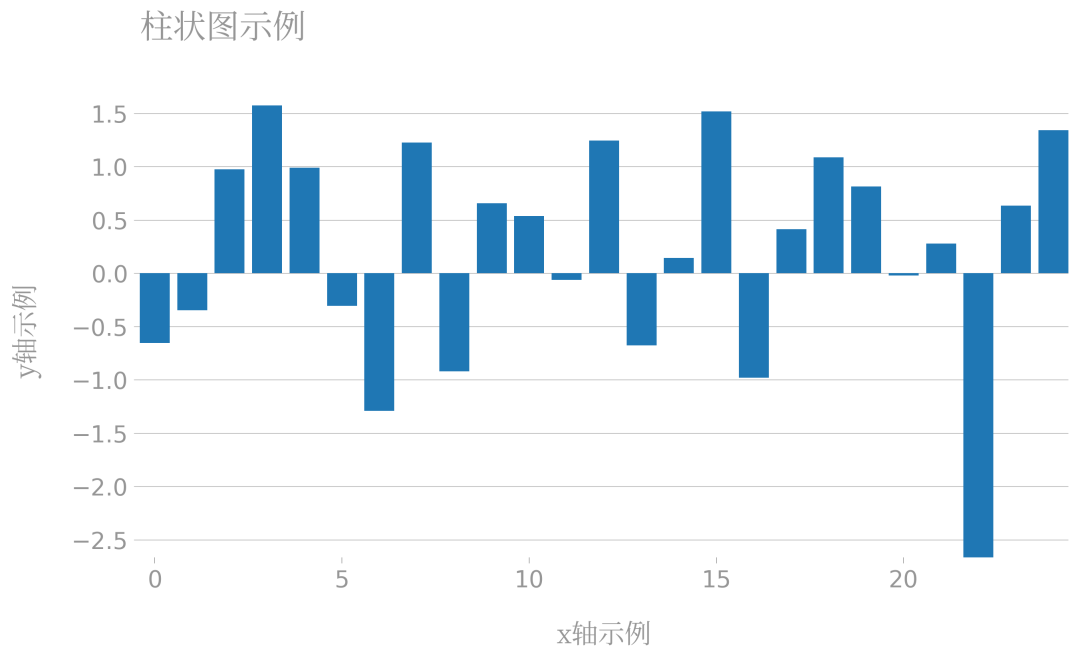

          可以看到,dufte自帶了一套簡潔的繪圖風格,主張去除多余的軸線,只保留必要的參考線,適用于我們?nèi)粘9ぷ髦械耐ㄓ贸鰣D需求。

          2. 自動圖例美化


          除了前面介紹的整體主題風格之外,dufte還自帶了一套圖例風格化策略,只需要在繪圖過程中利用dufte.legend()來代替matplotlib原有的legend()即可,以下面的折線圖為例:

          # 折線圖示例
          with plt.style.context(dufte.style):
              x = range(100)
              y1 = np.random.randint(-56100).cumsum()
              y2 = np.random.randint(-510100).cumsum()
              y3 = np.random.randint(-56100).cumsum()

              fig, ax = plt.subplots(figsize=(105), facecolor='white', edgecolor='white')

              ax.plot(x, y1, linestyle='dotted', label='Series 1')
              ax.plot(x, y2, linestyle='dashed', label='Series 2')
              ax.plot(x, y3, linestyle='dashdot', label='Series 3')

              ax.set_xlabel('x軸示例', fontproperties=fontproperties, fontsize=16)
              ax.set_ylabel('y軸示例', fontproperties=fontproperties, fontsize=16)

              dufte.legend()

              ax.set_title('dufte.legend()示例', fontproperties=fontproperties, fontsize=20)

              fig.savefig('圖4.png', dpi=300, bbox_inches='tight')
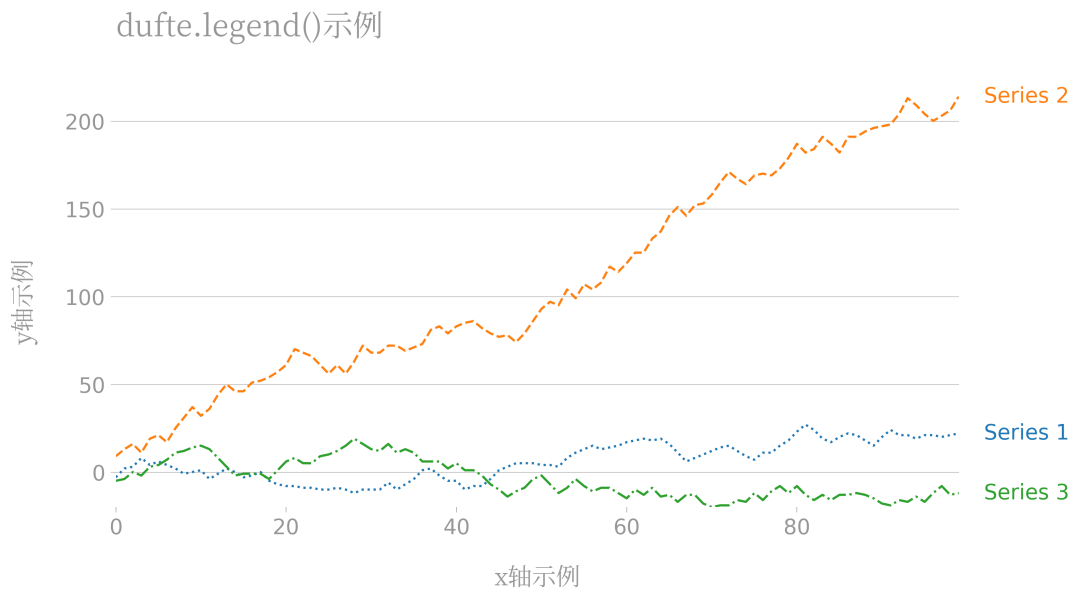
          可以看到,對于多系列圖表,只需要一行dufte.legend()就可以自動添加出下列別致的圖例說明:


          3. 柱狀圖自動標注


          很多時候我們在繪制柱狀圖時,希望把每個柱體對應的y值標注在柱體上,而通過dufte.show_bar_values(),只要其之前的繪圖流程中設置了xticks,它就會幫我們自動往柱體上標注信息:

          # 柱狀圖示例
          with plt.style.context(dufte.style):
              x = range(15)
              y = np.random.randint(51515)

              fig, ax = plt.subplots(figsize=(105), facecolor='white', edgecolor='white')

              ax.bar(x, y)

              ax.set_xticks(x)
              ax.set_xticklabels([f'項目{i}' for i in x], fontproperties=fontproperties, fontsize=10)
              dufte.show_bar_values()

              ax.set_xlabel('x軸示例', fontproperties=fontproperties, fontsize=16)
              ax.set_ylabel('y軸示例', fontproperties=fontproperties, fontsize=16)

              ax.set_title('柱狀圖示例', fontproperties=fontproperties, fontsize=20)

              fig.savefig('圖5.png', dpi=300, bbox_inches='tight')
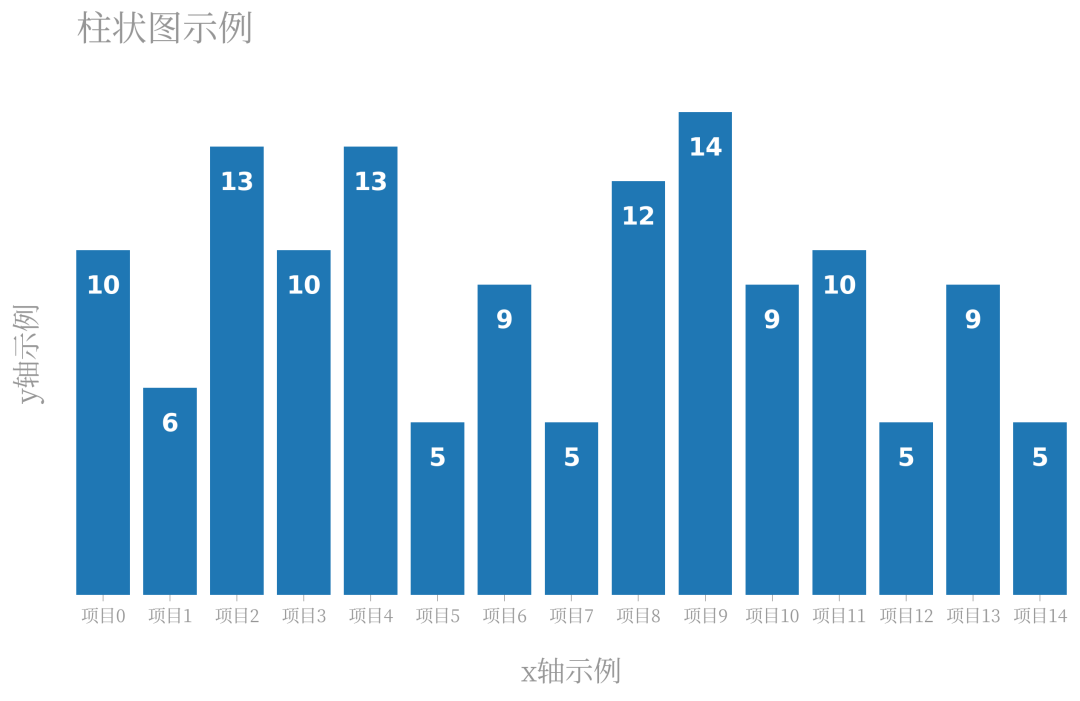

          作為一個處于開發(fā)初期的庫,dufte未來勢必會加入更多的實用功能,感興趣的朋友可以對其持續(xù)關(guān)注。


          延伸閱讀??

          Python數(shù)據(jù)分析與挖掘?qū)崙?zhàn)(第2版)


          干貨直達??


          更多精彩??

          在公眾號對話框輸入以下關(guān)鍵詞
          查看更多優(yōu)質(zhì)內(nèi)容!

          PPT | 讀書 | 書單 | 硬核 | 干貨 | 講明白 | 神操作
          大數(shù)據(jù) | 云計算 | 數(shù)據(jù)庫 | Python | 爬蟲 | 可視化
          AI | 人工智能 | 機器學習 | 深度學習 | NLP
          5G | 中臺 | 用戶畫像 1024 | 數(shù)學 | 算法 數(shù)字孿生

          據(jù)統(tǒng)計,99%的大咖都關(guān)注了這個公眾號
          ??
          瀏覽 17
          點贊
          評論
          收藏
          分享

          手機掃一掃分享

          分享
          舉報
          評論
          圖片
          表情
          推薦
          點贊
          評論
          收藏
          分享

          手機掃一掃分享

          分享
          舉報
          <kbd id="afajh"><form id="afajh"></form></kbd>
          <strong id="afajh"><dl id="afajh"></dl></strong>
            <del id="afajh"><form id="afajh"></form></del>
                1. <th id="afajh"><progress id="afajh"></progress></th>
                  <b id="afajh"><abbr id="afajh"></abbr></b>
                  <th id="afajh"><progress id="afajh"></progress></th>
                  99操逼| 波多野结衣做爱 | 日韩一级欧美一级黄色大片 | 北条麻妃喷水 | 欧美视频网站在线观看 |