
SpringBoot 服務(wù)啟動(dòng)慢排查思路
原文:
blog.csdn.net/lkx444368875/article/details/127268108
一個(gè)其他團(tuán)隊(duì)的比較老的dubbo服務(wù),spring的版本在3.2.x范圍,用的還是spring那一套。
由于這個(gè)服務(wù)比較核心,而且集成的組件比較多:rabbit、dubbo、es、kafka、zk、redis、cas等等一系列組件,然后開發(fā)的痛點(diǎn)就是本地啟動(dòng)時(shí)間太慢了,常常耗時(shí)接近10分鐘、機(jī)器配置差點(diǎn)夸張到10+。抱著好奇的心理開始這一次排查之旅。
啟動(dòng)耗時(shí) : Artifact xxxx:war exploded: Deploy took 730,358 milliseconds
優(yōu)化成果: Artifact xxxx:war exploded: Deploy took 95,078 milliseconds
由于老服務(wù)啟動(dòng)日志偏少,索性開始之前使用過的JProfiles來作為本次的分析工具,它可以實(shí)時(shí)偵測所有代碼的運(yùn)行耗時(shí)。對(duì)一些啟動(dòng)慢鏈路追蹤有非常好的幫助。
Jprofile - CPU檢測
基于Jprofile的使用文章
blog.csdn.net/lkx444368875/article/details/108799142
通過JProfile檢測,發(fā)現(xiàn)了一個(gè)比較耗時(shí)的點(diǎn):就是

這個(gè)類的作用是:
// 通過反射判斷實(shí)例是否存在
public static boolean isPresent(String className, ClassLoader classLoader) {
    try {
        forName(className, classLoader);
        return true;
    } catch (Throwable var3) {
        return false;
    }
}

/**
* The class name of AnnotatedElementUtils that is introduced since Spring Framework 4
*/
public static final String ANNOTATED_ELEMENT_UTILS_CLASS_NAME = "org.springframework.core.annotation.AnnotatedElementUtils";

// 往上追蹤的話是查找AnnotatedElementUtils是否存在
ClassUtils.isPresent(ANNOTATED_ELEMENT_UTILS_CLASS_NAME, classLoader)
很顯然這個(gè)過程就是nacos會(huì)判斷AnnotatedElementUtils是否存在,通過注釋我們可以了解到AnnotatedElementUtils這個(gè)類是Spring 4的版本,而這個(gè)服務(wù)還只是3.2.x,如果這個(gè)類沒有相當(dāng)于在掃描bean容器查看nacos相關(guān)注解的時(shí)候,所有類都會(huì)經(jīng)過classLoader判斷一遍,這些基本上都是無效判斷,類多了耗時(shí)嚴(yán)重。原本想著升級(jí)Spring版本,發(fā)現(xiàn)牽一發(fā)動(dòng)全身~那既然版本沒跟上那么就直接關(guān)閉該功能唄,
通過繼續(xù)往上追蹤com.alibaba.spring.util.AnnotationUtils#getAnnotationAttributes到這個(gè)類時(shí)有一個(gè)tryMergedAnnotation屬性的判斷:
public static AnnotationAttributes getAnnotationAttributes(AnnotatedElement annotatedElement,
            Class<? extends Annotation> annotationType,
            PropertyResolver propertyResolver,
            boolean classValuesAsString,
            boolean nestedAnnotationsAsMap,
            boolean ignoreDefaultValue,
            boolean tryMergedAnnotation,
            String... ignoreAttributeNames) {

    AnnotationAttributes attributes = null;

    if (tryMergedAnnotation) {
        attributes = tryGetMergedAnnotationAttributes(annotatedElement, annotationType, propertyResolver,
                classValuesAsString, nestedAnnotationsAsMap, ignoreDefaultValue, ignoreAttributeNames);
    }

    if (attributes == null) {
        attributes = getAnnotationAttributes(annotatedElement, annotationType, propertyResolver,
                classValuesAsString, nestedAnnotationsAsMap, ignoreDefaultValue, ignoreAttributeNames);
    }

    return attributes;
}
這個(gè)說明只有這個(gè)屬性為true的時(shí)候,才會(huì)掃描加載AnnotatedElementUtils,嗯,我們可以自己定義去覆蓋原本nacos自動(dòng)注冊的類,然后坑此坑次的在配置文件加上了。
<bean id="annotationNacosInjectedBeanPostProcessor"
    class="com.alibaba.nacos.spring.beans.factory.annotation.AnnotationNacosInjectedBeanPostProcessor">
  <property name="tryMergedAnnotation" value="false"/>
 </bean>

<bean id="nacosValueAnnotationBeanPostProcessor"
    class="com.alibaba.nacos.spring.context.annotation.config.NacosValueAnnotationBeanPostProcessor">
  <property name="tryMergedAnnotation" value="false"/>
</bean>
嗯,這個(gè)問題解決了,開始啟動(dòng)。
效果還是有的,時(shí)間減少了40%吧,但還是遠(yuǎn)遠(yuǎn)不夠,繼續(xù)觀察。
Artifact xxxx:war exploded: Deploy took 462,016 milliseconds
線程等待
通過日志發(fā)現(xiàn)經(jīng)過一段時(shí)間后,不打印了。
[2022-09-28 17:15:56.913][ WARN][][][SimpleAsyncTaskExecutor-1][o.s.a.r.l.SimpleMessageListenerContainer|1168]:Consumer raised exception, processing can restart if the connection factory supports it. Exception summary: org.springframework.amqp.AmqpConnectException: java.net.ConnectException: Connection timed out: connect
連接超時(shí),這個(gè)一看是rabbitMQ的,我想應(yīng)該也不會(huì)阻塞主線程吧?
這個(gè)時(shí)候我在想:主線程在干啥呀!?
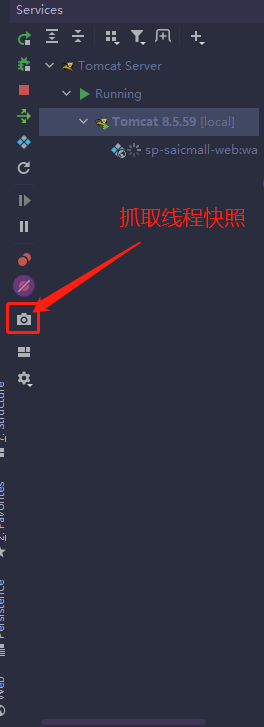
"RMI TCP Connection(3)-127.0.0.1@1830" daemon prio=5 tid=0x14 nid=NA waiting
  java.lang.Thread.State: WAITING
   at sun.misc.Unsafe.park(Unsafe.java:-1)
   at java.util.concurrent.locks.LockSupport.<obsolete>(LockSupport.java:-1)
   at java.util.concurrent.locks.AbstractQueuedSynchronizer.doAcquireSharedNanos(AbstractQueuedSynchronizer.java:1037)
   at java.util.concurrent.locks.AbstractQueuedSynchronizer.tryAcquireSharedNanos(AbstractQueuedSynchronizer.java:1328)
   at java.util.concurrent.CountDownLatch.await(CountDownLatch.java:277)
   at org.springframework.amqp.rabbit.listener.SimpleMessageListenerContainer$AsyncMessageProcessingConsumer.getStartupException(SimpleMessageListenerContainer.java:992)
   at org.springframework.amqp.rabbit.listener.SimpleMessageListenerContainer.doStart(SimpleMessageListenerContainer.java:666)
   - locked <0x3314> (a java.lang.Object)
   at org.springframework.amqp.rabbit.listener.AbstractMessageListenerContainer.start(AbstractMessageListenerContainer.java:458)
   at org.springframework.context.support.DefaultLifecycleProcessor.doStart(DefaultLifecycleProcessor.java:167)
   at org.springframework.context.support.DefaultLifecycleProcessor.access$200(DefaultLifecycleProcessor.java:51)
   at org.springframework.context.support.DefaultLifecycleProcessor$LifecycleGroup.start(DefaultLifecycleProcessor.java:339)
   at org.springframework.context.support.DefaultLifecycleProcessor.startBeans(DefaultLifecycleProcessor.java:143)
   at org.springframework.context.support.DefaultLifecycleProcessor.onRefresh(DefaultLifecycleProcessor.java:108)
   at org.springframework.context.support.AbstractApplicationContext.finishRefresh(AbstractApplicationContext.java:945)
   at org.springframework.context.support.AbstractApplicationContext.refresh(AbstractApplicationContext.java:482)
發(fā)現(xiàn)線程居然阻塞等待了!!!
通過觀察線程棧找到SimpleMessageListenerContainer這個(gè)類的getStartupException方法,看到了令我絕望的代碼
private final CountDownLatch start = new CountDownLatch(1);

public FatalListenerStartupException getStartupException() throws TimeoutException, InterruptedException {
    start.await(60000L, TimeUnit.MILLISECONDS);
    return this.startupException;
}

public void run() {
 SimpleMessageListenerContainer.this.redeclareElementsIfNecessary();
    this.consumer.start();
    this.start.countDown();

    // 省略
    restart(this.consumer);
}
它其實(shí)是有喚醒的操作的,但是由于啟動(dòng)不成功,喚醒不了,又觸發(fā)重試,繼續(xù)等待。但我沒想明白的是這個(gè)東西怎么是在主線程做的,也不確定是不是包版本太低的原因。
Rabbit連不上這個(gè)其實(shí)也是有原因的,因?yàn)槲覀冞@邊的本地的都是連的測試環(huán)境的,nacos的測試環(huán)境配置是阿里云內(nèi)網(wǎng)的地址,導(dǎo)致本地肯定是連不上的,所以我找了個(gè)公網(wǎng)地址試了一下,發(fā)現(xiàn)果然有用。
優(yōu)化成果: Artifact xxxx:war exploded: Deploy took 95,078 milliseconds
其實(shí)還發(fā)現(xiàn)了一些其他阻塞,不過都是屬于連接方面的,比如zk、數(shù)據(jù)庫等等,目前這個(gè)古老的項(xiàng)目1分半也屬于偏正常范圍吧,主要還是組件太多,代碼也多。
好了,本次排查到此為止。排查的手段和方案可以給大家提供一種思路~