
臥槽,一個牛逼的Python 可視化庫:PyG2Plot
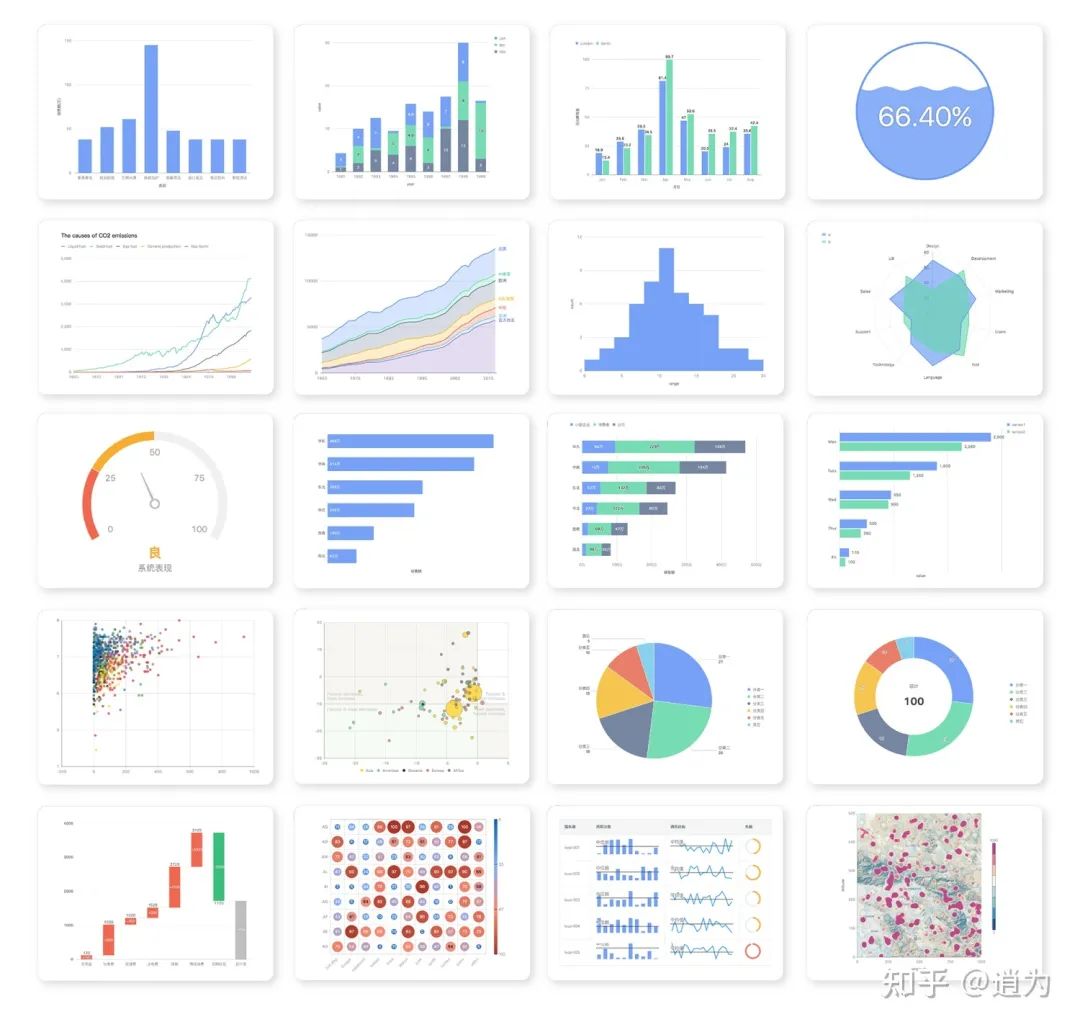
G2 是螞蟻金服開源一個基于圖形語法,面向數(shù)據(jù)分析的統(tǒng)計圖表引擎。G2Plot 是在 G2 基礎(chǔ)上,屏蔽復(fù)雜概念的前提下,保留 G2 強大圖形能力,封裝出業(yè)務(wù)上常用的統(tǒng)計圖表庫。
G2Plot 是一個基于配置、體驗優(yōu)雅、面向數(shù)據(jù)分析的統(tǒng)計圖表庫,幫助開發(fā)者以最小成本繪制高質(zhì)量統(tǒng)計圖表。
那么對于很多 Python 語言環(huán)境的同學(xué),如何使用 G2Plot 在進行數(shù)據(jù)分析之后的可視化呢?也就是
如何將 G2Plot 和 Python 結(jié)合起來?這里給出的就是基于 G2Plot 封裝出 PyG2Plot,歡迎幫我充一下 Star。
如何使用
pip install pyg2plot主要有 2 種使用方式(能力擴充中,歡迎提 issue)
1. 渲染出完整的 HTML
from pyg2plot import Plot

line = Plot("Line")

line.set_options({
  "data": [
    { "year": "1991", "value": 3 },
    { "year": "1992", "value": 4 },
    { "year": "1993", "value": 3.5 },
    { "year": "1994", "value": 5 },
    { "year": "1995", "value": 4.9 },
    { "year": "1996", "value": 6 },
    { "year": "1997", "value": 7 },
    { "year": "1998", "value": 9 },
    { "year": "1999", "value": 13 },
  ],
  "xField": "year",
  "yField": "value",
})

# 1. render html file named plot.html
line.render("plot.html")

# 2. render html string
line.render_html()
這種情況可以用于:
服務(wù)端 html 直出的場景
生成可交互可視化分享
Excel 等工具嵌入的場景
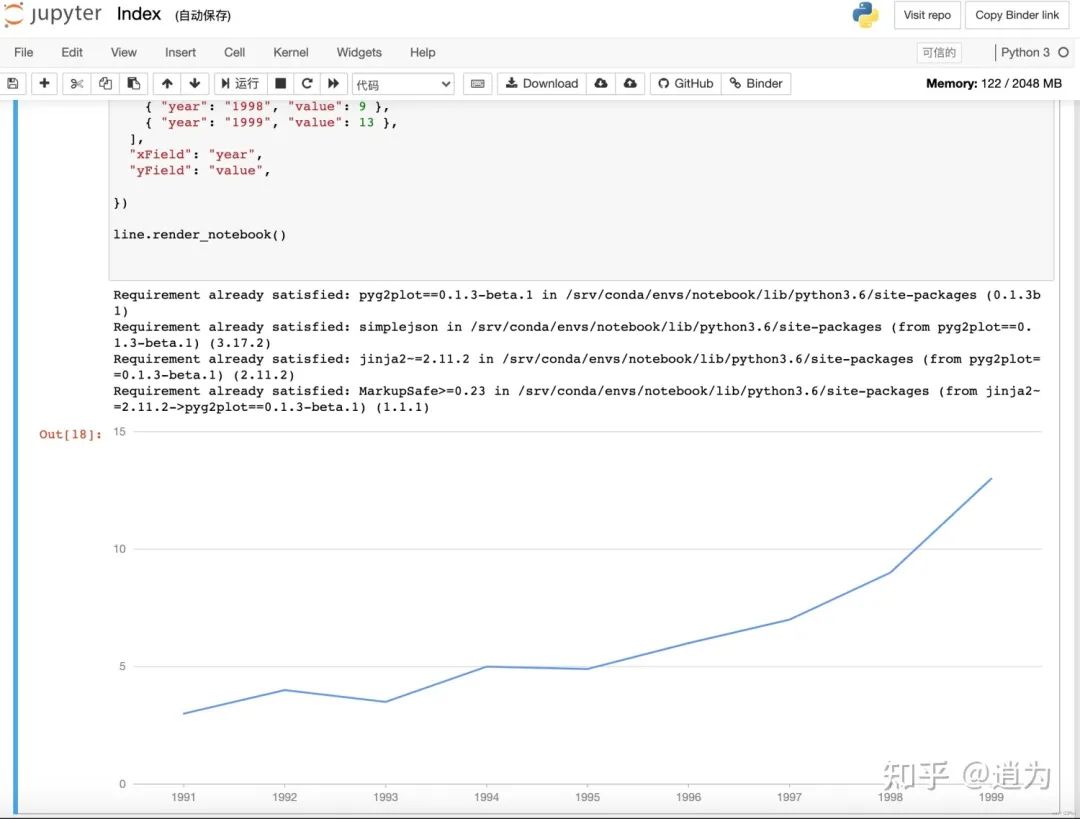
2. 在 Jupyter notebook 中預(yù)覽
from pyg2plot import Plot

line = Plot("Line")

line.set_options({
  "height": 400, # set a default height in jupyter preview
  "data": [
    { "year": "1991", "value": 3 },
    { "year": "1992", "value": 4 },
    { "year": "1993", "value": 3.5 },
    { "year": "1994", "value": 5 },
    { "year": "1995", "value": 4.9 },
    { "year": "1996", "value": 6 },
    { "year": "1997", "value": 7 },
    { "year": "1998", "value": 9 },
    { "year": "1999", "value": 13 },
  ],
  "xField": "year",
  "yField": "value",
})

line.render_notebook()
在我們做數(shù)據(jù)分析教程的過程中,可以將我們的數(shù)據(jù)使用 PyG2Plot 進行可視化并預(yù)覽出來,十分方便!
開發(fā)原理
PyG2Plot 原理其實非常簡單,其中借鑒了 pyecharts 的實現(xiàn),但是因為螞蟻金服的 G2Plot 完全基于可視分析理論的配置式結(jié)構(gòu),所以封裝上比 pyecharts 簡潔非常非常多。
基本的原理,就是通過 Python 語法提供 API,然后再調(diào)用 render 的時候,生成最終的 G2Plot HTML 文本,而針對不同的環(huán)境,生成的 HTML 稍有區(qū)別。
所以核心文件是:
plot.py:提供了 PyG2Plot 的幾乎全部 API
engine.py:提供了渲染 HTML 的能力,其實是基于 jinjia2 這個模板引擎實現(xiàn)的,基本內(nèi)容很少
templates:提供了所有的 jinjia2 模板文件,對于模板怎么用,jinjia2 的文檔是非常非常詳細的
使用文檔
PyG2Plot 提供的 API 非常簡單,使用上:
# 1. import
from pyg2plot import Plot

# 2. use a plot
line = Plot("Line")

# 3. set_options use G2Plot
line.set_options({ data, ... })

# 4. render
line.render_notebook()
而這其中 set_options API 的參數(shù),是完全沿用 G2Plot 的配置文檔,支持所有的圖表、功能、特性,概念和結(jié)構(gòu)上不作任何修改。
最后
歡迎給個 Star ?♂? 有任何的特性支持和 bug 反饋,歡迎 issue 或者 PR。
https://github.com/hustcc/PyG2Plot
https://github.com/antvis/G2Plot
給上方的兩個項目或者點擊閱讀原文給個Star吧!