
分享一個趣味性十足的Python可視化技巧

Python中的可視化模塊以及opencv模塊來識別出圖片當(dāng)中所有的顏色要素,并且將其添加到可視化圖表的配色當(dāng)中導(dǎo)入模塊并加載圖片
matplotlib模塊,我們將圖片中的顏色抽取出來之后會保存在顏色映射表中,所以要使用到colormap模塊,同樣也需要導(dǎo)入進(jìn)來import numpy as np
import pandas as pd
import matplotlib.pyplot as plt
import matplotlib.patches as patches
import matplotlib.image as mpimg
from PIL import Image
from matplotlib.offsetbox import OffsetImage, AnnotationBbox
import cv2
import extcolors
from colormap import rgb2hex
input_name = 'test_1.png'
img = plt.imread(input_name)
plt.imshow(img)
plt.axis('off')
plt.show()

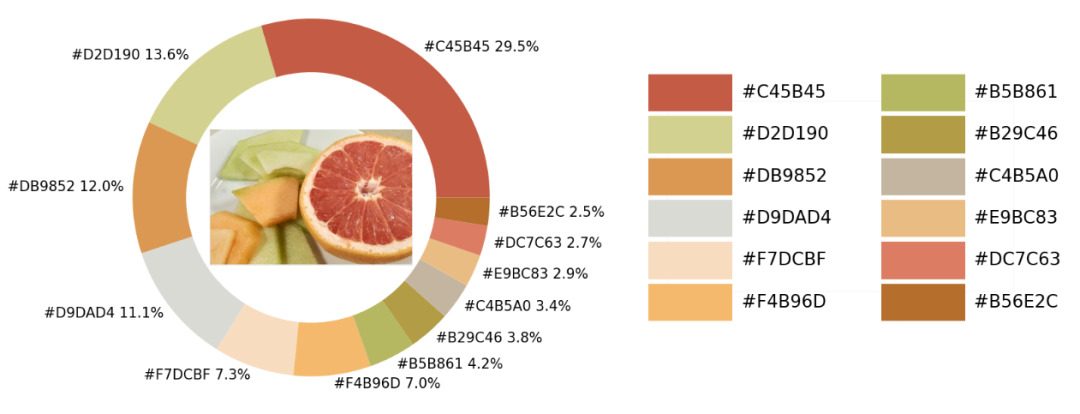
提取顏色并整合成表格
extcolors模塊來從圖片中提取顏色,輸出的結(jié)果是RGB形式呈現(xiàn)出來的顏色,代碼如下colors_x = extcolors.extract_from_path(img_url, tolerance=12, limit = 12)
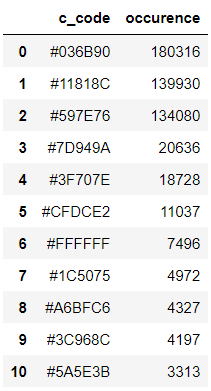
colors_x
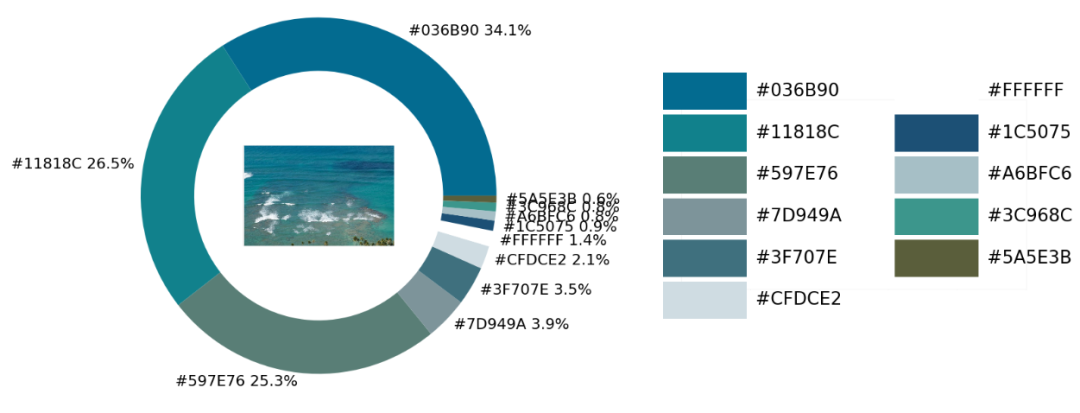
([((3, 107, 144), 180316),
  ((17, 129, 140), 139930),
  ((89, 126, 118), 134080),
  ((125, 148, 154), 20636),
  ((63, 112, 126), 18728),
  ((207, 220, 226), 11037),
  ((255, 255, 255), 7496),
  ((28, 80, 117), 4972),
  ((166, 191, 198), 4327),
  ((60, 150, 140), 4197),
  ((90, 94, 59), 3313),
  ((56, 66, 39), 1669)],
 538200)
DataFrame數(shù)據(jù)集,代碼如下def color_to_df(input_color):
colors_pre_list = str(input_color).replace('([(', '').split(', (')[0:-1]
df_rgb = [i.split('), ')[0] + ')' for i in colors_pre_list]
df_percent = [i.split('), ')[1].replace(')', '') for i in colors_pre_list]
# 將RGB轉(zhuǎn)換成十六進(jìn)制的顏色
df_color_up = [rgb2hex(int(i.split(", ")[0].replace("(", "")),
int(i.split(", ")[1]),
int(i.split(", ")[2].replace(")", ""))) for i in df_rgb]
df = pd.DataFrame(zip(df_color_up, df_percent), columns=['c_code', 'occurence'])
return df
DataFrame數(shù)據(jù)集當(dāng)中df_color = color_to_df(colors_x)
df_color
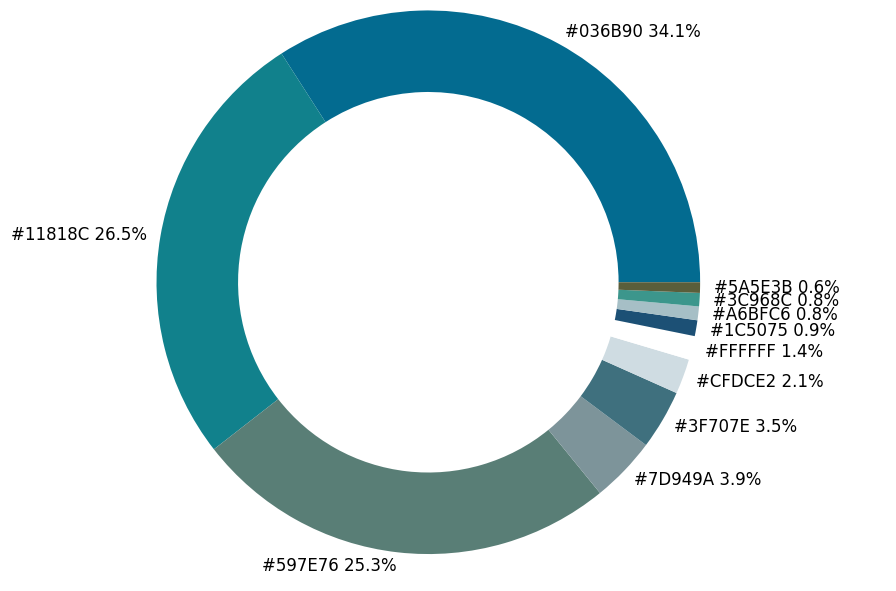
繪制圖表
matplotlib模塊,代碼如下fig, ax = plt.subplots(figsize=(90,90),dpi=10)
wedges, text = ax.pie(list_precent,
labels= text_c,
labeldistance= 1.05,
colors = list_color,
textprops={'fontsize': 120, 'color':'black'}
)
plt.setp(wedges, width=0.3)
ax.set_aspect("equal")
fig.set_facecolor('white')
plt.show()
imagebox = OffsetImage(img, zoom=2.3)
ab = AnnotationBbox(imagebox, (0, 0))
ax1.add_artist(ab)
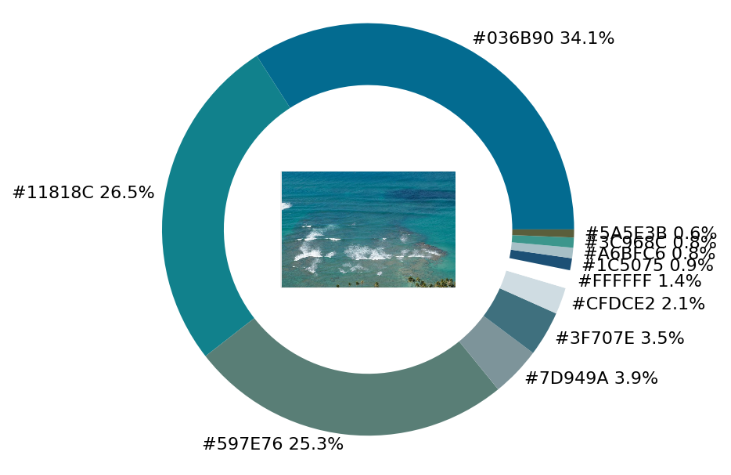
## 調(diào)色盤
x_posi, y_posi, y_posi2 = 160, -170, -170
for c in list_color:
    if list_color.index(c) <= 5:
        y_posi += 180
        rect = patches.Rectangle((x_posi, y_posi), 360, 160, facecolor = c)
        ax2.add_patch(rect)
        ax2.text(x = x_posi+400, y = y_posi+100, s = c, fontdict={'fontsize': 190})
    else:
        y_posi2 += 180
        rect = patches.Rectangle((x_posi + 1000, y_posi2), 360, 160, facecolor = c)
        ax2.add_artist(rect)
        ax2.text(x = x_posi+1400, y = y_posi2+100, s = c, fontdict={'fontsize': 190})

ax2.axis('off')
fig.set_facecolor('white')
plt.imshow(bg)
plt.tight_layout()
實戰(zhàn)環(huán)節(jié)
def exact_color(input_image, resize, tolerance, zoom):

    output_width = resize
    img = Image.open(input_image)
    if img.size[0] >= resize:
        wpercent = (output_width/float(img.size[0]))
        hsize = int((float(img.size[1])*float(wpercent)))
        img = img.resize((output_width,hsize), Image.ANTIALIAS)
        resize_name = 'resize_'+ input_image
        img.save(resize_name)
    else:
        resize_name = input_image

    fig.set_facecolor('white')
    ax2.axis('off')
    bg = plt.imread('bg.png')
    plt.imshow(bg)
    plt.tight_layout()
    return plt.show()

exact_color('test_2.png', 900, 12, 2.5)
往期推薦 1、統(tǒng)計千行代碼Bug率,有沒有意義? 2、工信部再推利民項目,這樣的良心工具越多越好 3、Python 任務(wù)自動化工具 tox 教程 4、用Python讀寫Word文檔入門 5、最好的python日期處理庫:pendulum 點擊關(guān)注公眾號,閱讀更多精彩內(nèi)容


評論
圖片
表情