
一個(gè)非常有趣的SQL優(yōu)化案例
問(wèn)題描述
分析
表的信息
估算cost
start-up cost
run cost
執(zhí)行計(jì)劃
實(shí)際執(zhí)行時(shí)間
從內(nèi)核視角來(lái)分析
解決方案
禁用走主鍵掃描
增加(user_id, id)索引
寫(xiě)在最后
Coding過(guò)程中經(jīng)常會(huì)寫(xiě)SQL語(yǔ)句,有時(shí)寫(xiě)的SQL出現(xiàn)慢查詢(xún)而被DBA鄙視。我們一起從使用者,DBA,內(nèi)核開(kāi)發(fā)三個(gè)不同角度來(lái)分析和解決一個(gè)SQL性能問(wèn)題。
問(wèn)題描述
A:兩條SQL語(yǔ)句只有l(wèi)imit不一樣,而 limit 1的執(zhí)行比limit 10的慢N倍我:是不是緩存問(wèn)題,先執(zhí)行 limit 10再執(zhí)行limit 1試試A:......,執(zhí)行了, limit還是很慢
select xxx from user_gift where user_id=11695667 and user_type = 'default' order by id desc limit 10;
select xxx from user_gift where user_id=11695667 and user_type = 'default' order by id desc limit 1;
表結(jié)構(gòu)
# \d user_gift;Table "yay.user_gift"Column | Type | Collation | Nullable | Default--------------+--------------------------+-----------+----------+------------------------------------------------id | bigint | | not null | nextval('user_gift_id_seq'::regclass)user_id | integer | | not null |ug_name | character varying(100) | | not null |expired_time | timestamp with time zone | | | now()created_time | timestamp with time zone | | not null | now()updated_time | timestamp with time zone | | not null | now()user_type | user_type | | not null | 'default'::user_typeIndexes:"user_gift_pkey" PRIMARY KEY, btree (id)"idx_user_type" btree (user_id, ug_name)"user_gift_ug_name_idx" btree (ug_name)
分析
執(zhí)行計(jì)劃
# explain analyze verbose select xxx from user_gift where user_id=11695667 and user_type = 'default' order by id desc limit 1;QUERY PLAN---------------------------------------------------------------------------------------------------------------------------------------------------------------------------Limit (cost=0.43..416.25 rows=1 width=73) (actual time=135.213..135.214 rows=1 loops=1)Output: xxx-> Index Scan Backward using user_gift_pkey on yay.user_gift (cost=0.43..368000.44 rows=885 width=73) (actual time=135.212..135.212 rows=1 loops=1)Output: xxxFilter: ((user_gift.user_id = 11695667) AND (user_gift.user_type = 'default'::user_type))Rows Removed by Filter: 330192Planning Time: 0.102 msExecution Time: 135.235 ms(8 rows)Time: 135.691 ms
# explain analyze verbose select xxx from user_gift where user_id=11695667 and user_type = 'default' order by id desc limit 10;QUERY PLAN----------------------------------------------------------------------------------------------------------------------------------------------------------Limit (cost=868.20..868.22 rows=10 width=73) (actual time=1.543..1.545 rows=10 loops=1)Output: xxx-> Sort (cost=868.20..870.41 rows=885 width=73) (actual time=1.543..1.543 rows=10 loops=1)Output: xxxSort Key: user_gift.id DESCSort Method: top-N heapsort Memory: 27kB-> Index Scan using idx_user_type on yay.user_gift (cost=0.56..849.07 rows=885 width=73) (actual time=0.020..1.366 rows=775 loops=1)Output: xxxIndex Cond: (user_gift.user_id = 11695667)Filter: (user_gift.user_type = 'default'::user_type)Planning Time: 0.079 msExecution Time: 1.564 ms(12 rows)Time: 1.871 ms
limit 1語(yǔ)句 :使用主鍵進(jìn)行倒序掃描,Index Scan Backward using user_gift_pkey on yay.user_giftlimit 10語(yǔ)句 :使用(user_id, user_type)復(fù)合索引直接查找用戶(hù)數(shù)據(jù),Index Scan using idx_user_type on yay.user_gift
limit 1的total costLimit (cost=0.43..416.25 rows=1 width=73) 是416,run cost是416-0.43=415.57。而limit 10的total costLimit (cost=868.20..868.22 rows=10 width=73)是868.22。Index Scan Backward using user_gift_pkey的方式估算,那么limit 1成本是415, limit 2是415*2=830, limit 3 是 1245,大于868,所以當(dāng)limit 3的時(shí)候會(huì)使用Index Scan using idx_user_type掃索引的計(jì)劃。# explain select xxx from user_gift where user_id=11695667 and user_type = 'default' order by id desc limit 2;QUERY PLAN-------------------------------------------------------------------------------------------------------------------------Limit (cost=0.43..831.95 rows=2 width=73)-> Index Scan Backward using user_gift_pkey on user_gift (cost=0.43..367528.67 rows=884 width=73)Filter: ((user_id = 11695667) AND (user_type = 'default'::user_type))(3 rows)Time: 0.341 ms# explain select xxx from user_gift where user_id=11695667 and user_type = 'default' order by id desc limit 3;QUERY PLAN----------------------------------------------------------------------------------------------------------Limit (cost=866.19..866.20 rows=3 width=73)-> Sort (cost=866.19..868.40 rows=884 width=73)Sort Key: id DESC-> Index Scan using idx_user_type on user_gift (cost=0.56..854.76 rows=884 width=73)Index Cond: (user_id = 11695667)Filter: (user_type = 'default'::user_type)(6 rows)Time: 0.352 ms
當(dāng) limit 2時(shí),執(zhí)行計(jì)劃是Index Scan Backward using user_gift_pkey當(dāng) limit 3時(shí),就改變計(jì)劃了,Index Scan using idx_user_type on user_gift
實(shí)際執(zhí)行時(shí)間
limit 1時(shí)成本估算的是416.25,比limit 10的868.22還是要快的。但是實(shí)際
limit 1執(zhí)行cost是135.691 ms,而limit 10執(zhí)行cost是1.871 ms,比limit 10慢了70倍!!!# explain (analyze, buffers, verbose) select xxx from user_gift where user_id=11695667 and user_type = 'default' order by id desc limit 1;QUERY PLAN---------------------------------------------------------------------------------------------------------------------------------------------------------------------------Limit (cost=0.43..416.29 rows=1 width=73) (actual time=451.542..451.544 rows=1 loops=1)Output: xxxBuffers: shared hit=214402 read=5280 dirtied=2302I/O Timings: read=205.027-> Index Scan Backward using user_gift_pkey on yay.user_gift (cost=0.43..368032.94 rows=885 width=73) (actual time=451.540..451.540 rows=1 loops=1)Output: xxxFilter: ((user_gift.user_id = 11695667) AND (user_gift.user_type = 'default'::user_type))Rows Removed by Filter: 333462Buffers: shared hit=214402 read=5280 dirtied=2302I/O Timings: read=205.027Planning Time: 1.106 msExecution Time: 451.594 ms(12 rows)
# explain (analyze, buffers, verbose) select xxx from user_gift where user_id=11695667 and user_type = 'default' order by id desc limit 3;QUERY PLAN-----------------------------------------------------------------------------------------------------------------------------------------------------------Limit (cost=860.51..860.52 rows=3 width=73) (actual time=14.633..14.634 rows=3 loops=1)Output: xxxBuffers: shared hit=467 read=321I/O Timings: read=10.112-> Sort (cost=860.51..862.72 rows=885 width=73) (actual time=14.632..14.632 rows=3 loops=1)Output: xxxSort Key: user_gift.id DESCSort Method: top-N heapsort Memory: 25kBBuffers: shared hit=467 read=321I/O Timings: read=10.112-> Index Scan using idx_user_type on yay.user_gift (cost=0.56..849.07 rows=885 width=73) (actual time=0.192..14.424 rows=775 loops=1)Output: xxxIndex Cond: (user_gift.user_id = 11695667)Filter: (user_gift.user_type = 'default'::user_type)Buffers: shared hit=464 read=321I/O Timings: read=10.112Planning Time: 0.111 msExecution Time: 14.658 ms(18 rows)
limit 1時(shí)的IO成本I/O Timings: read=205.027,Rows Removed by Filter: 333462顯示過(guò)濾了333462行記錄limit 3時(shí)IO成本I/O Timings: read=10.112, ?
Buffers: shared hit=214402 read=5280 dirtied=2302可以看出limit 1的計(jì)劃從磁盤(pán)讀取了5280個(gè)blocks(pages)才找到符合where條件的記錄。schemaname | yaytablename | user_giftattname | idinherited | fnull_frac | 0avg_width | 8n_distinct | -1most_common_vals |most_common_freqs |histogram_bounds | {93,9817,19893,28177,.......}correlation | 0.788011most_common_elems |most_common_elem_freqs |elem_count_histogram |schemaname | yaytablename | user_giftattname | user_idinherited | fnull_frac | 0avg_width | 4n_distinct | -0.175761most_common_vals | {11576819,10299480,14020501,.......,11695667,......}most_common_freqs | {0.000353333,0.000326667,0.000246667,......,9.33333e-05,......}histogram_bounds | {3,10002181,10005599,10009672,......,11693300,11698290,......}correlation | 0.53375most_common_elems |most_common_elem_freqs |elem_count_histogram |schemaname | yaytablename | user_giftattname | user_typeinherited | fnull_frac | 0avg_width | 4n_distinct | 3most_common_vals | {default, invalid, deleted}most_common_freqs | {0.997923,0.00194,0.000136667}histogram_bounds |correlation | 0.99763most_common_elems |most_common_elem_freqs |elem_count_histogram |
user_id字段的most_common_vals中有11695667(user_id)的值,則可以直接通過(guò)其對(duì)應(yīng)的most_common_freqs來(lái)得到其selectivity是9.33333e-05;user_type字段為default對(duì)應(yīng)的selectivity是0.997923。?所以 where user_id=11695667 and user_type='default'的selectivity是0.0000933333*0.997923 = 0.0000931394467359。?
(cost=0.43..367528.67 rows=884 width=73)的884行一樣。從user_gift_pkey(主鍵id)掃描的話(huà):只要掃描9499740/884=10746行就能找到滿(mǎn)足條件的記錄,且無(wú)須進(jìn)行排序( order by id desc)從idx_user_type索引掃描的話(huà):雖然能很快找到此用戶(hù)的數(shù)據(jù),但是需要給884行進(jìn)行排序,掃描+排序的cost比從主鍵掃描要高。?
表最大的page=128709
# select max(ctid) from user_gift;max-------------(128709,29)(1 row)
user id=11695667的最大page=124329
# select max(ctid), min(ctid) from user_gift where user_id=11695667;max | min-------------+-----------(124329,22) | (3951,64)(1 row)
表本身的pages和tuples數(shù)量
# SELECT relpages, reltuples FROM pg_class WHERE relname = 'user_gift';relpages | reltuples----------+-------------128875 | 9.49974e+06(1 row)
limit 1時(shí)掃描了5280個(gè)pages(包含了主鍵索引的pages),過(guò)濾了333462萬(wàn)行記錄,和估算的基本一樣:Rows Removed by Filter: 333462Buffers: shared hit=214402 read=5280 dirtied=2302I/O Timings: read=205.027
優(yōu)化器假設(shè)數(shù)據(jù)分布均勻,只需要掃描10746個(gè)記錄 而實(shí)際需要掃描322862個(gè)記錄
[root]$ fio -name iops -rw=read -bs=8k -runtime=10 -iodepth=1 -filename /dev/sdb -ioengine libaio -direct=1...Run status group 0 (all jobs):READ: bw=193MiB/s (202MB/s), 193MiB/s-193MiB/s (202MB/s-202MB/s), io=1928MiB (2022MB), run=10001-10001msec
fio結(jié)果可以看出,此數(shù)據(jù)庫(kù)機(jī)器磁盤(pán)的順序讀取速度約為 200MB/s,那么掃描40MB數(shù)據(jù)需要約200ms,與實(shí)際需要的時(shí)間205ms基本相等。postgreSQL的優(yōu)化器認(rèn)為數(shù)據(jù)分布是均勻的,只需要倒序掃描很快就找到符合條件的記錄,而實(shí)際上此用戶(hù)的數(shù)據(jù)分布在表的前端,就導(dǎo)致了實(shí)際執(zhí)行start-up time如此慢了。
從內(nèi)核視角來(lái)分析
優(yōu)化器如何估算cost 優(yōu)化器如何統(tǒng)計(jì)actual time
表的信息
主鍵索引
# SELECT relpages, reltuples FROM pg_class WHERE relname = 'user_gift_pkey';relpages | reltuples----------+-------------40035 | 9.49974e+06(1 row)
user_id 索引
# SELECT relpages, reltuples FROM pg_class WHERE relname = 'idx_user_type';relpages | reltuples----------+-------------113572 | 9.49974e+06(1 row)
表本身的pages是128875
# SELECT relpages, reltuples FROM pg_class WHERE relname = 'user_gift';relpages | reltuples----------+-------------128875 | 9.49974e+06(1 row)
user id=11695667的數(shù)據(jù)775行
=# select count(1) from user_gift where user_id=11695667;count-------775(1 row)=# select count(1) from user_gift where user_id=11695667 and user_type = 'default' ;count-------775(1 row)
樹(shù)高度
# 主鍵高度# select * from bt_metap('user_gift_pkey');magic | version | root | level | fastroot | fastlevel | oldest_xact | last_cleanup_num_tuples--------+---------+------+-------+----------+-----------+-------------+-------------------------340322 | 3 | 412 | 2 | 412 | 2 | 0 | 9.31928e+06(1 row)// idx_user_type 高度# select * from bt_metap('idx_user_type');magic | version | root | level | fastroot | fastlevel | oldest_xact | last_cleanup_num_tuples--------+---------+-------+-------+----------+-----------+-------------+-------------------------340322 | 3 | 15094 | 3 | 15094 | 3 | 0 | 9.49974e+06(1 row)
估算cost
start-up cost
// selfuncs.cvoidbtcostestimate(PlannerInfo *root, IndexPath *path, double loop_count,Cost *indexStartupCost, Cost *indexTotalCost,Selectivity *indexSelectivity, double *indexCorrelation,double *indexPages){......descentCost = ceil(log(index->tuples) / log(2.0)) * cpu_operator_cost;costs.indexStartupCost += descentCost;......// This cost is somewhat arbitrarily set at 50x cpu_operator_cost per page toucheddescentCost = (index->tree_height + 1) * 50.0 * cpu_operator_cost;costs.indexStartupCost += descentCost;......}

N(index,tuple) :索引tuples(記錄)數(shù)量 ? Height(index) :索引B+tree的高度 cpu_operator_cost : 默認(rèn)值0.0025
N(index,tuple) :9.49974e+06, ? ? Height(index) :2

和postgreSQL估算的start-up cost=0.43 一樣。
N(index,tuple) :9.49974e+06, ? ? Height(index) :3

run cost
src/backend/optimizer/path/costsize.c的cost_index函數(shù)。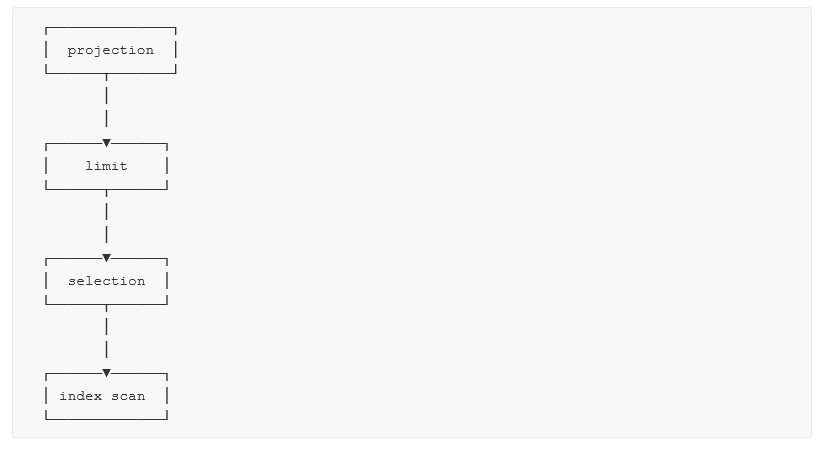
index scan executor:掃描到一個(gè)tuple,就返回給selection executor selection executor:對(duì)tuple進(jìn)行過(guò)濾,如果符合條件則返回給limit executor,如果不符合則繼續(xù)調(diào)用index scan executor limit executor:當(dāng)達(dá)到limit限制則將數(shù)據(jù)返回給projection executor projection executor:過(guò)濾掉非 select列的數(shù)據(jù)
selection executor和projection executor合并到index scan executor中執(zhí)行,以減少數(shù)據(jù)在executor之間的傳遞。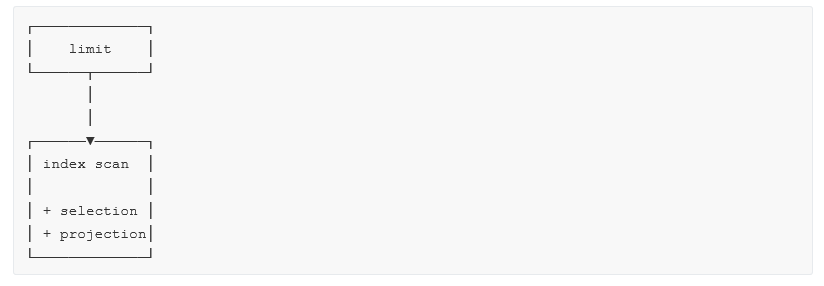
index scan executor:掃描到tuple,然后進(jìn)行selection過(guò)濾,如果符合條件就進(jìn)行projection再返回給limit,如果不符合條件,則繼續(xù)掃描 limit executor:當(dāng)達(dá)到limit限制則將數(shù)據(jù)返回
// src/backend/executor/execProcnode.cstatic TupleTableSlot *ExecProcNodeInstr(PlanState *node){TupleTableSlot *result;InstrStartNode(node->instrument);result = node->ExecProcNodeReal(node);// 統(tǒng)計(jì)執(zhí)行指標(biāo)InstrStopNode(node->instrument, TupIsNull(result) ? 0.0 : 1.0);return result;}
where語(yǔ)句的第一條結(jié)果為止。user_id=xxx的過(guò)濾已經(jīng)下沉到index scan executor里面了。---> int4eq(FunctionCallInfo fcinfo) (/home/ken/cpp/postgres/src/backend/utils/adt/int.c:379)ExecInterpExpr(ExprState * state, ExprContext * econtext, _Bool * isnull) (/home/ken/cpp/postgres/src/backend/executor/execExprInterp.c:704)ExecInterpExprStillValid(ExprState * state, ExprContext * econtext, _Bool * isNull) (/home/ken/cpp/postgres/src/backend/executor/execExprInterp.c:1807)ExecEvalExprSwitchContext(ExprState * state, ExprContext * econtext, _Bool * isNull) (/home/ken/cpp/postgres/src/include/executor/executor.h:322)---> ExecQual(ExprState * state, ExprContext * econtext) (/home/ken/cpp/postgres/src/include/executor/executor.h:391)ExecScan(ScanState * node, ExecScanAccessMtd accessMtd, ExecScanRecheckMtd recheckMtd) (/home/ken/cpp/postgres/src/backend/executor/execScan.c:227)---> ExecIndexScan(PlanState * pstate) (/home/ken/cpp/postgres/src/backend/executor/nodeIndexscan.c:537)ExecProcNodeInstr(PlanState * node) (/home/ken/cpp/postgres/src/backend/executor/execProcnode.c:466)ExecProcNodeFirst(PlanState * node) (/home/ken/cpp/postgres/src/backend/executor/execProcnode.c:450)ExecProcNode(PlanState * node) (/home/ken/cpp/postgres/src/include/executor/executor.h:248)---> ExecLimit(PlanState * pstate) (/home/ken/cpp/postgres/src/backend/executor/nodeLimit.c:96)ExecProcNodeInstr(PlanState * node) (/home/ken/cpp/postgres/src/backend/executor/execProcnode.c:466)ExecProcNodeFirst(PlanState * node) (/home/ken/cpp/postgres/src/backend/executor/execProcnode.c:450)ExecProcNode(PlanState * node) (/home/ken/cpp/postgres/src/include/executor/executor.h:248)ExecutePlan(EState * estate, PlanState * planstate, _Bool use_parallel_mode, CmdType operation, _Bool sendTuples, uint64 numberTuples, ScanDirection direction, DestReceiver * dest, _Bool execute_once) (/home/ken/cpp/postgres/src/backend/executor/execMain.c:1632)standard_ExecutorRun(QueryDesc * queryDesc, ScanDirection direction, uint64 count, _Bool execute_once) (/home/ken/cpp/postgres/src/backend/executor/execMain.c:350)ExecutorRun(QueryDesc * queryDesc, ScanDirection direction, uint64 count, _Bool execute_once) (/home/ken/cpp/postgres/src/backend/executor/execMain.c:294)ExplainOnePlan(PlannedStmt * plannedstmt, IntoClause * into, ExplainState * es, const char * queryString, ParamListInfo params, QueryEnvironment * queryEnv, const instr_time * planduration, const BufferUsage * bufusage) (/home/ken/cpp/postgres/src/backend/commands/explain.c:571)ExplainOneQuery(Query * query, int cursorOptions, IntoClause * into, ExplainState * es, const char * queryString, ParamListInfo params, QueryEnvironment * queryEnv) (/home/ken/cpp/postgres/src/backend/commands/explain.c:404)ExplainQuery(ParseState * pstate, ExplainStmt * stmt, ParamListInfo params, DestReceiver * dest) (/home/ken/cpp/postgres/src/backend/commands/explain.c:275)
ExecQual(qual, econtext)是對(duì)tuple進(jìn)行過(guò)濾,因?yàn)閟election已經(jīng)合并到scan中了。TupleTableSlot *ExecScan(ScanState *node, ExecScanAccessMtd accessMtd, ExecScanRecheckMtd recheckMtd){......for (;;){TupleTableSlot *slot;slot = ExecScanFetch(node, accessMtd, recheckMtd);......econtext->ecxt_scantuple = slot;// Note : selection判斷if (qual == NULL || ExecQual(qual, econtext)){if (projInfo){return ExecProject(projInfo);}else{return slot;}}elseInstrCountFiltered1(node, 1);}}
解決方案
禁用走主鍵掃描
# explain analyze verbose select xxx from user_gift where user_id=11695667 and user_type = 'default' order by id+0 desc limit 1;
order by id改成order by id+0,由于id+0是個(gè)表達(dá)式所以?xún)?yōu)化器就就不會(huì)使用user_gift_pkey這個(gè)索引了。增加(user_id, id)索引
create index idx_user_id on user_gift(user_id, id);
寫(xiě)在最后
態(tài)黑色音符") ?END?
?END?
分享一下我寫(xiě)的《10萬(wàn)字Springboot經(jīng)典學(xué)習(xí)筆記》中,點(diǎn)擊下面小卡片,進(jìn)入【Java禿頭哥】,回復(fù):筆記,即可免費(fèi)獲取。
點(diǎn)贊是最大的支持?

評(píng)論
圖片
表情