
快來試試 Spring Boot 應(yīng)用可視化監(jiān)控,一目了然!

閱讀本文大概需要 2 分鐘。
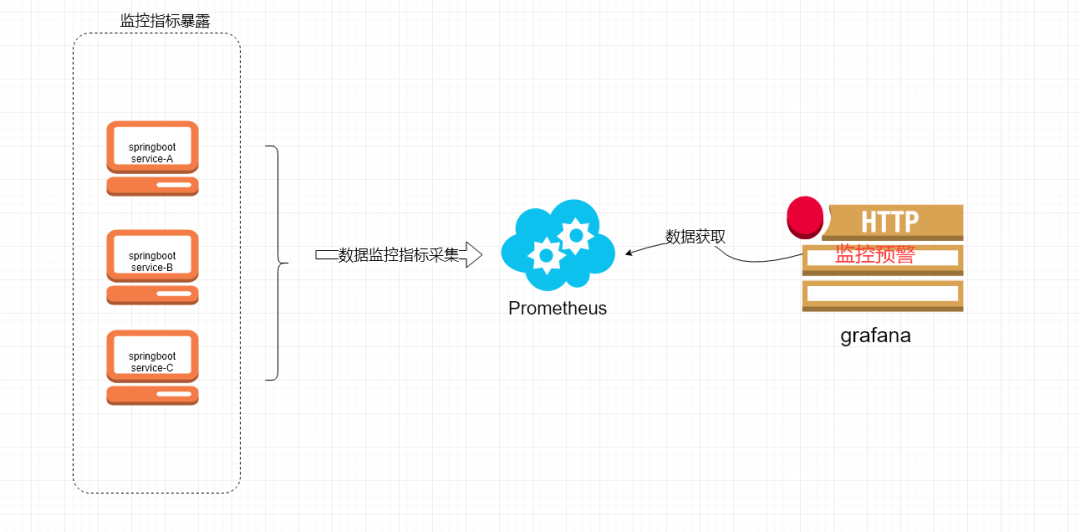
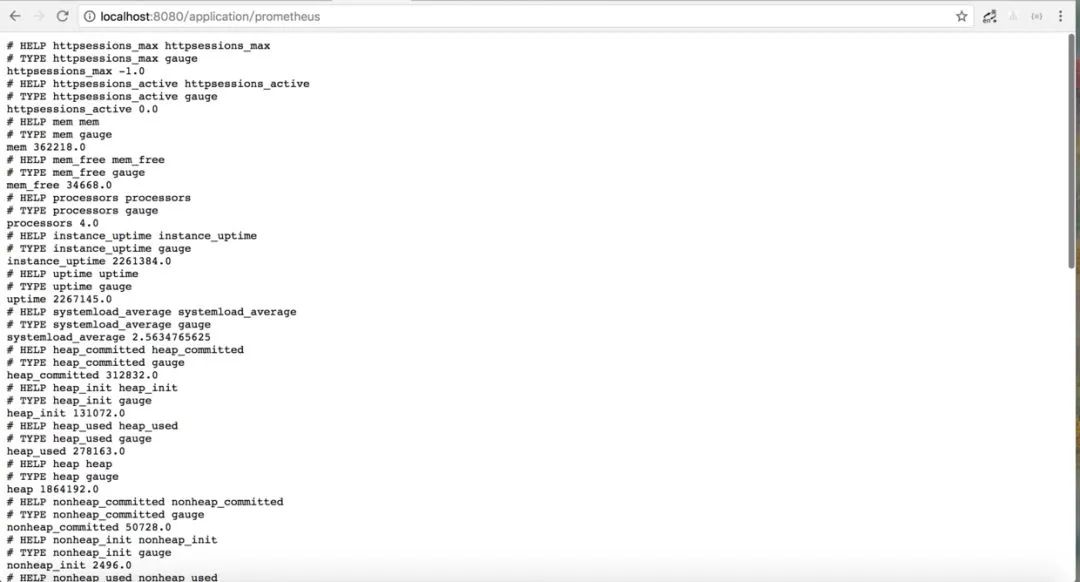
1、Spring Boot 應(yīng)用暴露監(jiān)控指標(biāo)【版本 1.5.7.RELEASE】
<dependency><groupId>org.springframework.boot</groupId><artifactId>spring-boot-starter-actuator</artifactId></dependency>
<dependency><groupId>io.prometheus</groupId><artifactId>simpleclient_spring_boot</artifactId> <version>0.0.26</version></dependency>
Application.java 添加如下注解:@SpringBootApplication@EnablePrometheusEndpoint@EnableSpringBootMetricsCollectorpublic class Application {public static void main(String[] args) { SpringApplication.run(Application.class, args);}}
application.yml 中:security:user:name:userpassword: pwd
Mappings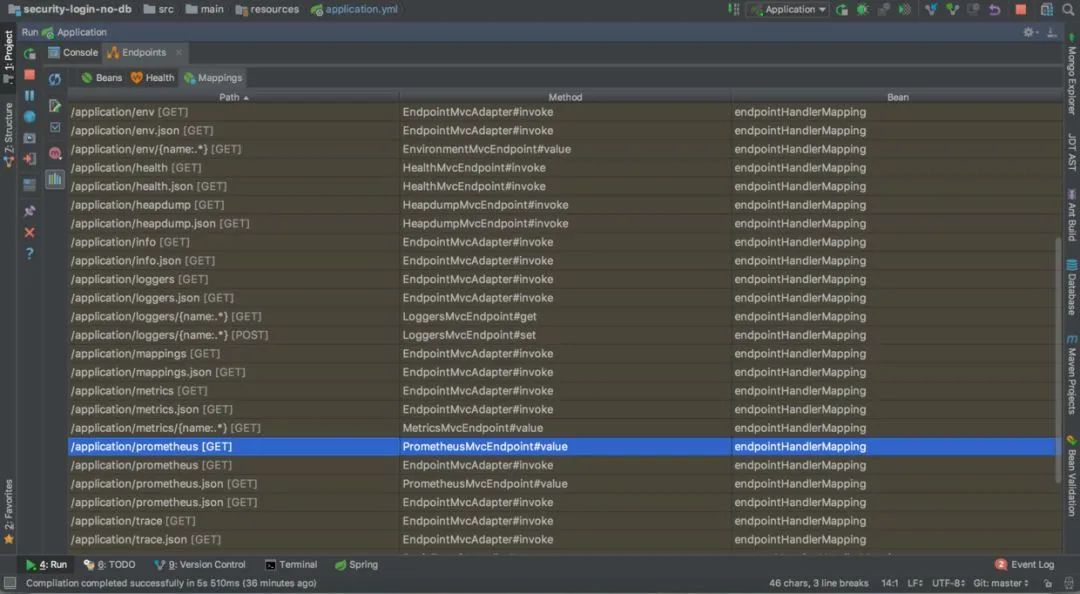
2、Prometheus 采集 Spring Boot 指標(biāo)數(shù)據(jù)
docker pull prom/prometheus
prometheus.yml :global:scrape_interval: 10sscrape_timeout: 10sevaluation_interval: 10mscrape_configs:job_name: spring-bootscrape_interval: 5sscrape_timeout: 5smetrics_path: /application/prometheusscheme: httpbasic_auth:username: adminpassword: 123456static_configs:targets:192.168.11.54:8099 #此處填寫 Spring Boot 應(yīng)用的 IP + 端口號
docker run -d --name prometheus -p 9090:9090-v D:\test\actuator\prometheus\prometheus.yml:/etc/prometheus/prometheus.yml prom/prometheus
請注意, D:\test\actuator\prometheus\prometheus.yml,是我的配置文件存放地址,我們需要將它放到容器里面去,所以用了-v來做文件映射。/etc/prometheus/prometheus.yml這個(gè)是容器啟動的時(shí)候去取的默認(rèn)配置,這里我是直接覆蓋掉了它。prom/prometheus這是鏡像,如果本地沒有,就回去你設(shè)置好的鏡像倉庫去取。
docker ps看下是否已經(jīng)啟動成功,之后打開瀏覽器輸入:http://localhost:9090/targets,檢查 Spring Boot 采集狀態(tài)是否正常,如果看到下圖就是成功了。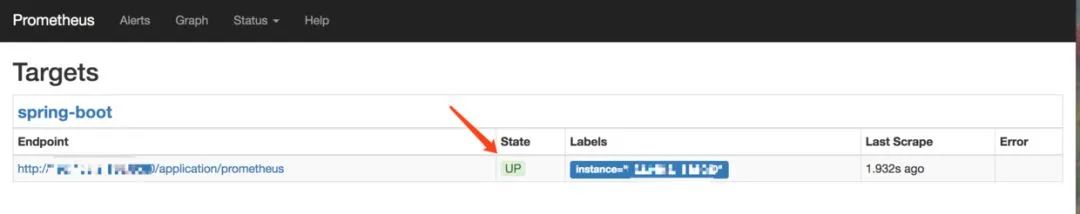
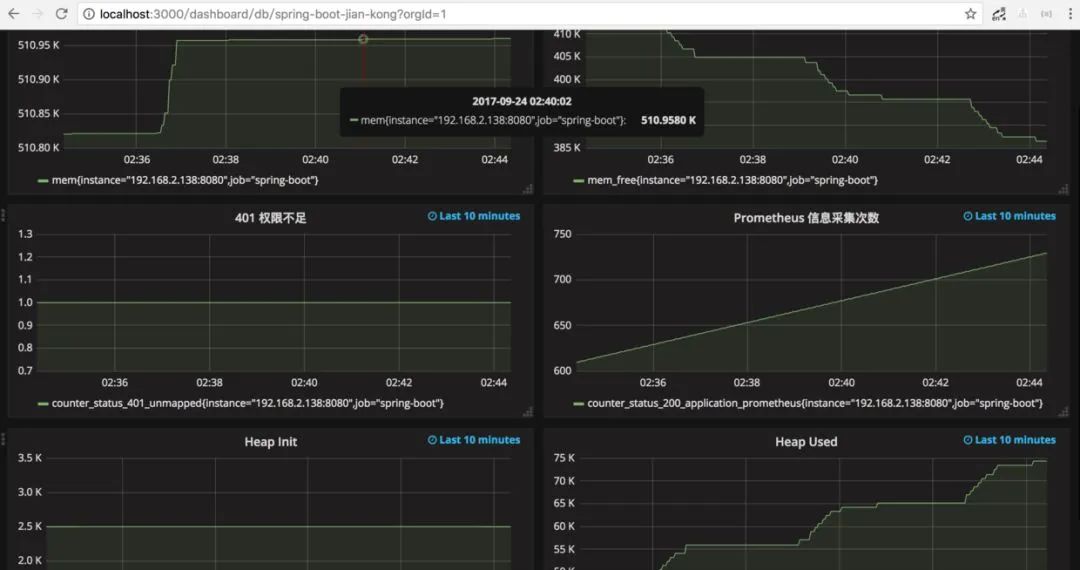
3、Grafana 可視化監(jiān)控?cái)?shù)據(jù)
docker pull grafana/grafana1
docker run --name grafana -d -p 3000:3000 grafana/grafana1
Grafana 登錄賬號 admin 密碼 admin
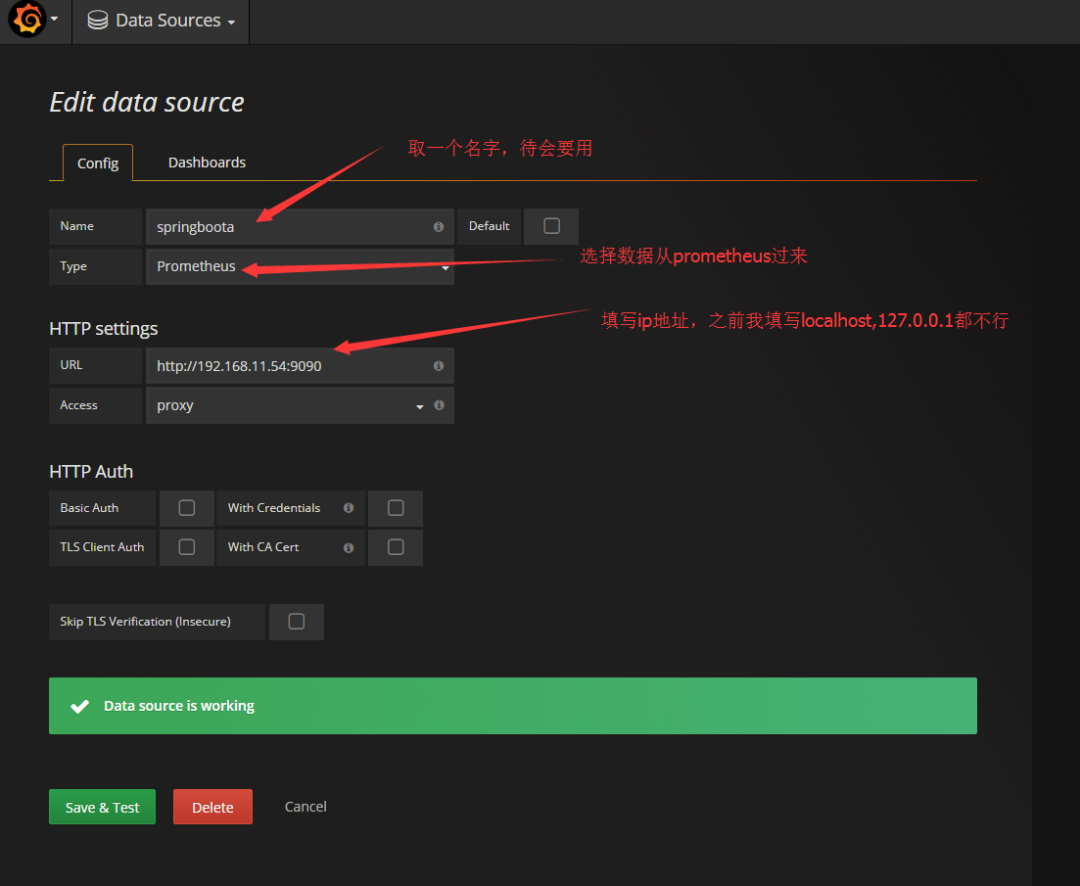
先配置數(shù)據(jù)源.
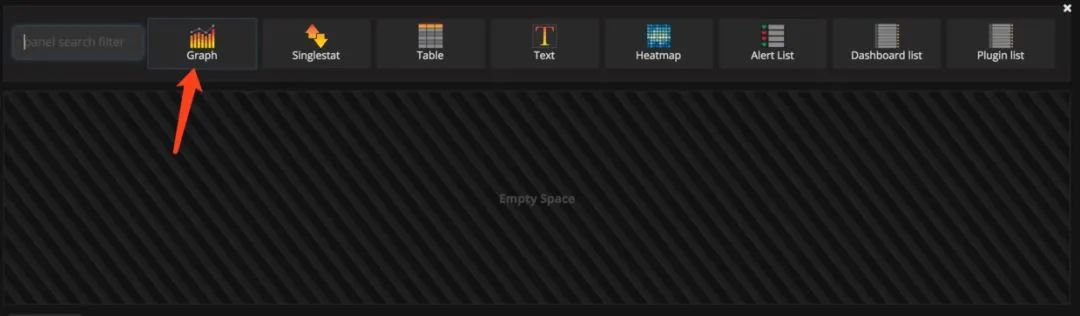
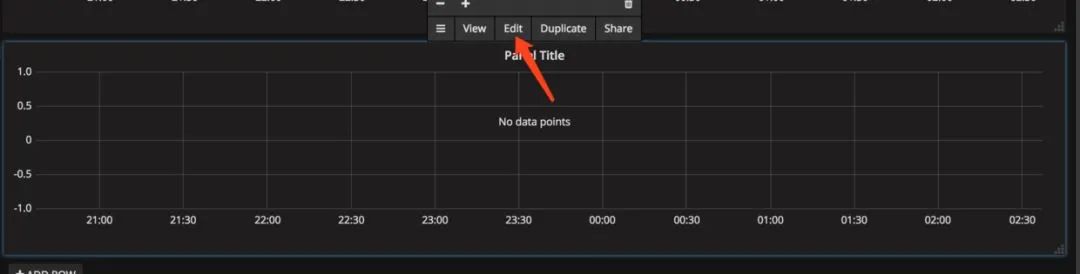
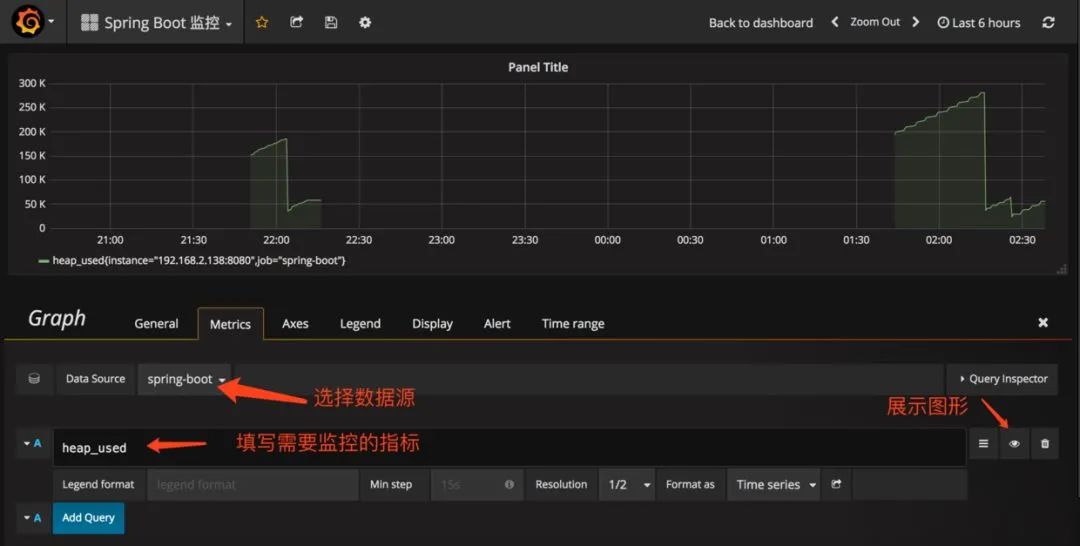
prometh采集的數(shù)據(jù)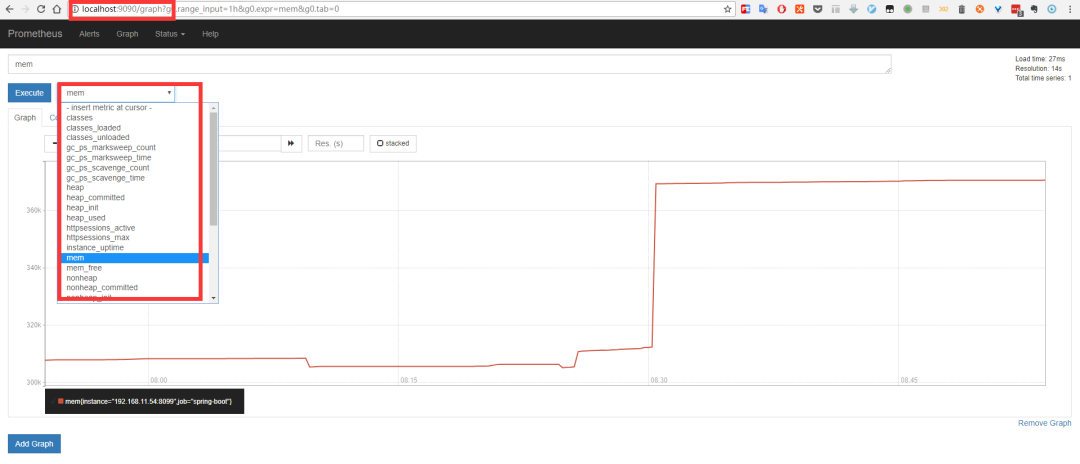
推薦閱讀:
最近面試BAT,整理一份面試資料《Java面試BATJ通關(guān)手冊》,覆蓋了Java核心技術(shù)、JVM、Java并發(fā)、SSM、微服務(wù)、數(shù)據(jù)庫、數(shù)據(jù)結(jié)構(gòu)等等。
朕已閱 
評論
圖片
表情