
Spring Boot 應(yīng)用可視化監(jiān)控,一目了然!
1、Spring Boot 應(yīng)用暴露監(jiān)控指標(biāo)
首先,添加依賴如下依賴:
<dependency>
   <groupId>org.springframework.boot</groupId>
   <artifactId>spring-boot-starter-actuator</artifactId>
</dependency>
采集應(yīng)用的指標(biāo)信息,我們使用的是prometheus,相應(yīng)的我們引入包:
<dependency>
   <groupId>io.prometheus</groupId>
   <artifactId>simpleclient_spring_boot</artifactId>
   <version>0.0.26</version>
</dependency>
Application.java 添加如下注解:@SpringBootApplication
@EnablePrometheusEndpoint
@EnableSpringBootMetricsCollector
public class Application {
public static void main(String[] args) {
SpringApplication.run(Application.class, args);
}
}
application.yml 中:security:
user:
name:user
password: pwd
啟動應(yīng)用程序后,會看到如下一系列的 Mappings
利用賬號密碼訪問 http://localhost:8080/application/prometheus ,可以看到 Prometheus 格式的指標(biāo)數(shù)據(jù):
2、Prometheus 采集 Spring Boot 指標(biāo)數(shù)據(jù)
首先,獲取 Prometheus 的 Docker 鏡像:
$ docker pull prom/prometheus
然后,編寫配置文件 prometheus.yml :
global:
  scrape_interval: 10s
  scrape_timeout: 10s
  evaluation_interval: 10m
scrape_configs:
  - job_name: spring-boot
    scrape_interval: 5s
    scrape_timeout: 5s
    metrics_path: /application/prometheus
    scheme: http
    basic_auth:
      username: admin
      password: 123456
    static_configs:
      - targets:
        - 192.168.11.54:8099 #此處填寫 Spring Boot 應(yīng)用的 IP + 端口號
接著,啟動 Prometheus :
docker run -d --name prometheus -p 9090:9090
-v D:\test\actuator\prometheus\prometheus.yml:/etc/prometheus/prometheus.yml prom/prometheus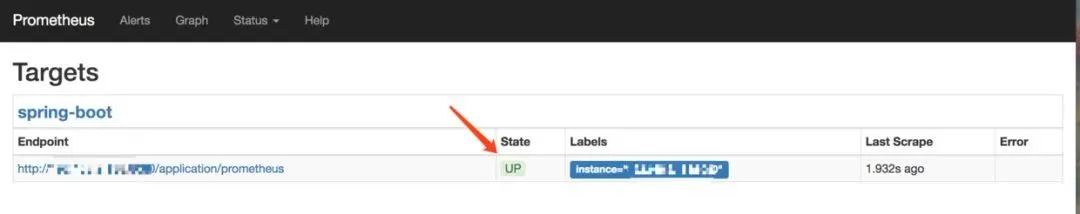
3、Grafana 可視化監(jiān)控數(shù)據(jù)
首先,獲取 Grafana 的 Docker 鏡像:
$ docker pull grafana/grafana1
然后,啟動 Grafana:
$ docker run --name grafana -d -p 3000:3000 grafana/grafana1
接著,訪問 http://localhost:3000/ 配置 Prometheus 數(shù)據(jù)源:
Grafana 登錄賬號 admin 密碼 admin
先配置數(shù)據(jù)源.
2.配置單個指標(biāo)的可視化監(jiān)控面板:
prometh采集的數(shù)據(jù):
1、2019 年 9 月全國程序員工資統(tǒng)計,你是什么水平?
3、從零開始搭建創(chuàng)業(yè)公司后臺技術(shù)棧
5、37歲程序員被裁,120天沒找到工作,無奈去小公司,結(jié)果懵了...
6、滴滴業(yè)務(wù)中臺構(gòu)建實(shí)踐,首次曝光
評論
圖片
表情