
如何爬升用于機(jī)器學(xué)習(xí)的測(cè)試集

無需查看訓(xùn)練數(shù)據(jù)集,就可以通過爬上測(cè)試集來做出完美的預(yù)測(cè)。 如何為分類和回歸任務(wù)爬坡測(cè)試集。 當(dāng)我們過度使用測(cè)試集來評(píng)估建模管道時(shí),我們暗中爬升了測(cè)試集。
爬坡測(cè)試儀 爬山算法 如何進(jìn)行爬山 爬坡糖尿病分類數(shù)據(jù)集 爬坡房屋回歸數(shù)據(jù)集
# example of a synthetic dataset.
from sklearn.datasets import make_classification
from sklearn.model_selection import train_test_split
# define dataset
X, y = make_classification(n_samples=5000, n_features=20, n_informative=15, n_redundant=5, random_state=1)
print(X.shape, y.shape)
# split dataset
X_train, X_test, y_train, y_test = train_test_split(X, y, test_size=0.33, random_state=1)
print(X_train.shape, X_test.shape, y_train.shape, y_test.shape)
(5000, 20) (5000,)
(3350, 20) (1650, 20) (3350,) (1650,)
# load or prepare the classification dataset
def load_dataset():
 return make_classification(n_samples=5000, n_features=20, n_informative=15, n_redundant=5, random_state=1)
# evaluate a set of predictions
def evaluate_predictions(y_test, yhat):
 return accuracy_score(y_test, yhat)
randint()函數(shù)生成0和1的隨機(jī)值。# create a random set of predictions
def random_predictions(n_examples):
return [randint(0, 1) for _ in range(n_examples)]
# modify the current set of predictions
def modify_predictions(current, n_changes=1):
# copy current solution
updated = current.copy()
for i in range(n_changes):
# select a point to change
ix = randint(0, len(updated)-1)
# flip the class label
updated[ix] = 1 - updated[ix]
return updated
random_predictions()函數(shù)和隨后的validate_predictions()函數(shù)來創(chuàng)建和評(píng)估初始解決方案。然后,我們循環(huán)進(jìn)行固定次數(shù)的迭代,并通過調(diào)用Modify_predictions()生成一個(gè)新的候選值,對(duì)其進(jìn)行求值,如果分?jǐn)?shù)與當(dāng)前解決方案相同或更好,則將其替換。當(dāng)我們完成預(yù)設(shè)的迭代次數(shù)(任意選擇)或達(dá)到理想分?jǐn)?shù)時(shí),該循環(huán)結(jié)束,在這種情況下,我們知道其精度為1.0(100%)。下面的函數(shù)hill_climb_testset()實(shí)現(xiàn)了此功能,將測(cè)試集作為輸入并返回在爬坡過程中發(fā)現(xiàn)的最佳預(yù)測(cè)集。# run a hill climb for a set of predictions
def hill_climb_testset(X_test, y_test, max_iterations):
scores = list()
# generate the initial solution
solution = random_predictions(X_test.shape[0])
# evaluate the initial solution
score = evaluate_predictions(y_test, solution)
scores.append(score)
# hill climb to a solution
for i in range(max_iterations):
# record scores
scores.append(score)
# stop once we achieve the best score
if score == 1.0:
break
# generate new candidate
candidate = modify_predictions(solution)
# evaluate candidate
value = evaluate_predictions(y_test, candidate)
# check if it is as good or better
if value >= score:
solution, score = candidate, value
print('>%d, score=%.3f' % (i, score))
return solution, scores
# example of hill climbing the test set for a classification task
from random import randint
from sklearn.datasets import make_classification
from sklearn.model_selection import train_test_split
from sklearn.metrics import accuracy_score
from matplotlib import pyplot
# load or prepare the classification dataset
def load_dataset():
return make_classification(n_samples=5000, n_features=20, n_informative=15, n_redundant=5, random_state=1)
# evaluate a set of predictions
def evaluate_predictions(y_test, yhat):
return accuracy_score(y_test, yhat)
# create a random set of predictions
def random_predictions(n_examples):
 return [randint(0, 1) for _ in range(n_examples)]
# modify the current set of predictions
def modify_predictions(current, n_changes=1):
 # copy current solution
 updated = current.copy()
 for i in range(n_changes):
  # select a point to change
  ix = randint(0, len(updated)-1)
  # flip the class label
  updated[ix] = 1 - updated[ix]
 return updated
# run a hill climb for a set of predictions
def hill_climb_testset(X_test, y_test, max_iterations):
 scores = list()
 # generate the initial solution
 solution = random_predictions(X_test.shape[0])
 # evaluate the initial solution
 score = evaluate_predictions(y_test, solution)
 scores.append(score)
 # hill climb to a solution
 for i in range(max_iterations):
  # record scores
  scores.append(score)
  # stop once we achieve the best score
  if score == 1.0:
   break
  # generate new candidate
  candidate = modify_predictions(solution)
  # evaluate candidate
  value = evaluate_predictions(y_test, candidate)
  # check if it is as good or better
  if value >= score:
   solution, score = candidate, value
   print('>%d, score=%.3f' % (i, score))
 return solution, scores
# load the dataset
X, y = load_dataset()
print(X.shape, y.shape)
# split dataset into train and test sets
X_train, X_test, y_train, y_test = train_test_split(X, y, test_size=0.33, random_state=1)
print(X_train.shape, X_test.shape, y_train.shape, y_test.shape)
# run hill climb
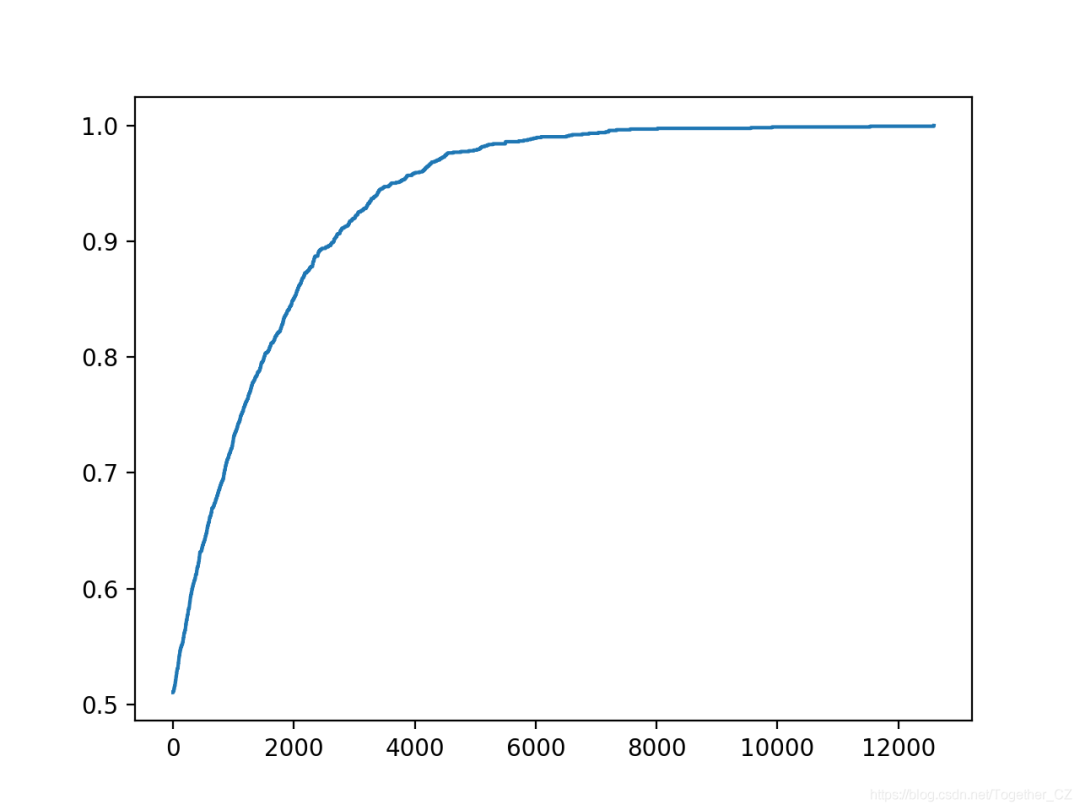
yhat, scores = hill_climb_testset(X_test, y_test, 20000)
# plot the scores vs iterations
pyplot.plot(scores)
pyplot.show()
...
>8092, score=0.996
>8886, score=0.997
>9202, score=0.998
>9322, score=0.998
>9521, score=0.999
>11046, score=0.999
>12932, score=1.000
pima-indians-diabetes.names數(shù)據(jù)集:pima-indians-diabetes.csv6,148,72,35,0,33.6,0.627,50,1
1,85,66,29,0,26.6,0.351,31,0
8,183,64,0,0,23.3,0.672,32,1
1,89,66,23,94,28.1,0.167,21,0
0,137,40,35,168,43.1,2.288,33,1
...
# load or prepare the classification dataset
def load_dataset():
 url = 'https://raw.githubusercontent.com/jbrownlee/Datasets/master/pima-indians-diabetes.csv'
 df = read_csv(url, header=None)
 data = df.values
 return data[:, :-1], data[:, -1]
# example of hill climbing the test set for the diabetes dataset
from random import randint
from pandas import read_csv
from sklearn.model_selection import train_test_split
from sklearn.metrics import accuracy_score
from matplotlib import pyplot

# load or prepare the classification dataset
def load_dataset():
 url = 'https://raw.githubusercontent.com/jbrownlee/Datasets/master/pima-indians-diabetes.csv'
 df = read_csv(url, header=None)
 data = df.values
 return data[:, :-1], data[:, -1]

# evaluate a set of predictions
def evaluate_predictions(y_test, yhat):
 return accuracy_score(y_test, yhat)

# create a random set of predictions
def random_predictions(n_examples):
 return [randint(0, 1) for _ in range(n_examples)]

# modify the current set of predictions
def modify_predictions(current, n_changes=1):
 # copy current solution
 updated = current.copy()
 for i in range(n_changes):
  # select a point to change
  ix = randint(0, len(updated)-1)
  # flip the class label
  updated[ix] = 1 - updated[ix]
 return updated

# run a hill climb for a set of predictions
def hill_climb_testset(X_test, y_test, max_iterations):
 scores = list()
 # generate the initial solution
 solution = random_predictions(X_test.shape[0])
 # evaluate the initial solution
 score = evaluate_predictions(y_test, solution)
 scores.append(score)
 # hill climb to a solution
 for i in range(max_iterations):
  # record scores
  scores.append(score)
  # stop once we achieve the best score
  if score == 1.0:
   break
  # generate new candidate
  candidate = modify_predictions(solution)
  # evaluate candidate
  value = evaluate_predictions(y_test, candidate)
  # check if it is as good or better
  if value >= score:
   solution, score = candidate, value
   print('>%d, score=%.3f' % (i, score))
 return solution, scores

# load the dataset
X, y = load_dataset()
print(X.shape, y.shape)
# split dataset into train and test sets
X_train, X_test, y_train, y_test = train_test_split(X, y, test_size=0.33, random_state=1)
print(X_train.shape, X_test.shape, y_train.shape, y_test.shape)
# run hill climb
yhat, scores = hill_climb_testset(X_test, y_test, 5000)
# plot the scores vs iterations
pyplot.plot(scores)
pyplot.show()
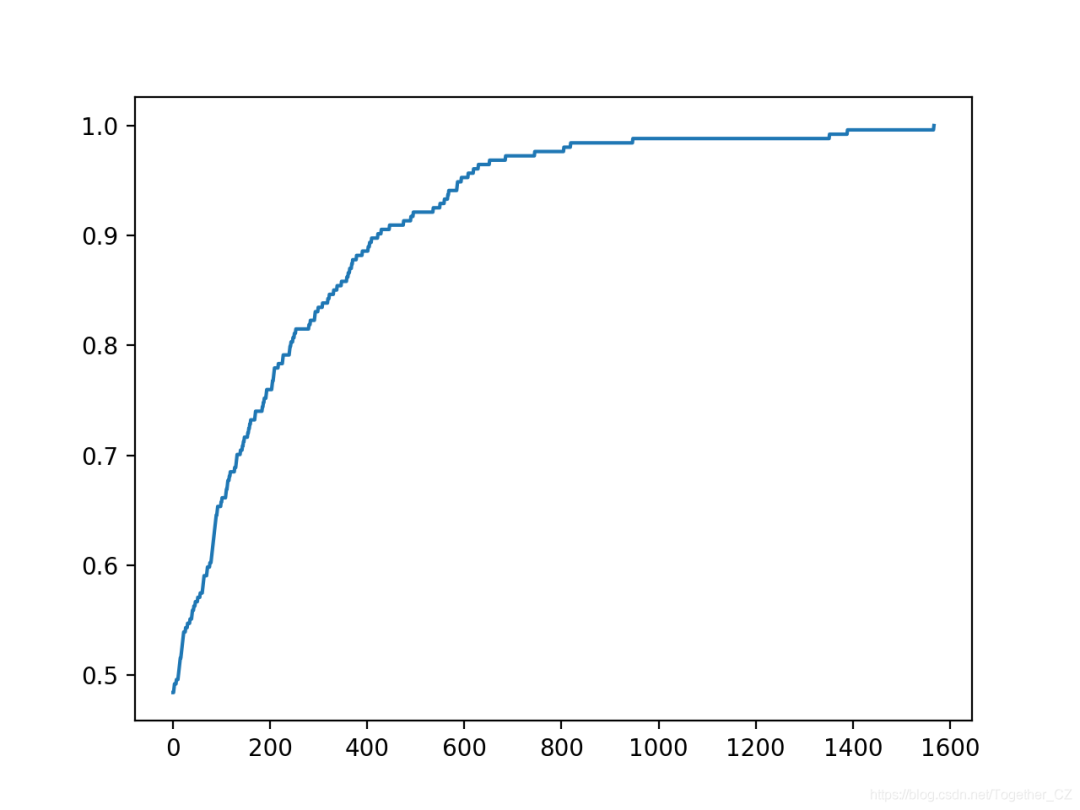
運(yùn)行示例將報(bào)告每次搜索過程中看到改進(jìn)時(shí)的迭代次數(shù)和準(zhǔn)確性。
在這種情況下,我們使用的迭代次數(shù)較少,因?yàn)橐M(jìn)行的預(yù)測(cè)較少,因此優(yōu)化起來比較簡(jiǎn)單。
注意:由于算法或評(píng)估程序的隨機(jī)性,或者數(shù)值精度的差異,您的結(jié)果可能會(huì)有所不同。考慮運(yùn)行該示例幾次并比較平均結(jié)果。
在這種情況下,我們可以看到在大約1,500次迭代中達(dá)到了完美的精度。
...
>617, score=0.961
>627, score=0.965
>650, score=0.969
>683, score=0.972
>743, score=0.976
>803, score=0.980
>817, score=0.984
>945, score=0.988
>1350, score=0.992
>1387, score=0.996
>1565, score=1.000
還創(chuàng)建了搜索進(jìn)度的折線圖,表明收斂迅速。
爬坡房屋回歸數(shù)據(jù)集
我們將使用住房數(shù)據(jù)集作為探索爬坡測(cè)試集回歸問題的基礎(chǔ)。住房數(shù)據(jù)集包含給定房屋及其附近地區(qū)詳細(xì)信息的數(shù)千美元房屋價(jià)格預(yù)測(cè)。
數(shù)據(jù)集詳細(xì)信息:housing.names數(shù)據(jù)集:housing.csv
這是一個(gè)回歸問題,這意味著我們正在預(yù)測(cè)一個(gè)數(shù)值。共有506個(gè)觀測(cè)值,其中包含13個(gè)輸入變量和一個(gè)輸出變量。下面列出了前五行的示例。
0.00632,18.00,2.310,0,0.5380,6.5750,65.20,4.0900,1,296.0,15.30,396.90,4.98,24.00
0.02731,0.00,7.070,0,0.4690,6.4210,78.90,4.9671,2,242.0,17.80,396.90,9.14,21.60
0.02729,0.00,7.070,0,0.4690,7.1850,61.10,4.9671,2,242.0,17.80,392.83,4.03,34.70
0.03237,0.00,2.180,0,0.4580,6.9980,45.80,6.0622,3,222.0,18.70,394.63,2.94,33.40
0.06905,0.00,2.180,0,0.4580,7.1470,54.20,6.0622,3,222.0,18.70,396.90,5.33,36.20
...
load_dataset()函數(shù)以加載住房數(shù)據(jù)集。作為加載數(shù)據(jù)集的一部分,我們將標(biāo)準(zhǔn)化目標(biāo)值。由于我們可以將浮點(diǎn)值限制在0到1的范圍內(nèi),這將使爬坡的預(yù)測(cè)更加簡(jiǎn)單。通常不需要這樣做,只是此處采用的簡(jiǎn)化搜索算法的方法。# load or prepare the classification dataset
def load_dataset():
url = 'https://raw.githubusercontent.com/jbrownlee/Datasets/master/housing.csv'
df = read_csv(url, header=None)
data = df.values
X, y = data[:, :-1], data[:, -1]
# normalize the target
scaler = MinMaxScaler()
y = y.reshape((len(y), 1))
y = scaler.fit_transform(y)
return X, y
# evaluate a set of predictions
def evaluate_predictions(y_test, yhat):
return mean_absolute_error(y_test, yhat)
我們還必須將解決方案的表示形式從0和1標(biāo)簽更新為介于0和1之間的浮點(diǎn)值。必須更改初始候選解的生成以創(chuàng)建隨機(jī)浮點(diǎn)列表。
# create a random set of predictions
def random_predictions(n_examples):
return [random() for _ in range(n_examples)]
# modify the current set of predictions
def modify_predictions(current, n_changes=1):
# copy current solution
updated = current.copy()
for i in range(n_changes):
# select a point to change
ix = randint(0, len(updated)-1)
# flip the class label
updated[ix] = random()
return updated
# add gaussian noise
updated[ix] += gauss(0, 0.1)
# stop once we achieve the best score
if score == 0.0:
break
# check if it is as good or better
if value <= score:
solution, score = candidate, value
print('>%d, score=%.3f' % (i, score))
# run a hill climb for a set of predictions
def hill_climb_testset(X_test, y_test, max_iterations):
scores = list()
# generate the initial solution
solution = random_predictions(X_test.shape[0])
# evaluate the initial solution
score = evaluate_predictions(y_test, solution)
print('>%.3f' % score)
# hill climb to a solution
for i in range(max_iterations):
# record scores
scores.append(score)
# stop once we achieve the best score
if score == 0.0:
break
# generate new candidate
candidate = modify_predictions(solution)
# evaluate candidate
value = evaluate_predictions(y_test, candidate)
# check if it is as good or better
if value <= score:
solution, score = candidate, value
print('>%d, score=%.3f' % (i, score))
return solution, scores
# example of hill climbing the test set for the housing dataset
from random import random
from random import randint
from pandas import read_csv
from sklearn.model_selection import train_test_split
from sklearn.metrics import mean_absolute_error
from sklearn.preprocessing import MinMaxScaler
from matplotlib import pyplot
# load or prepare the classification dataset
def load_dataset():
 url = 'https://raw.githubusercontent.com/jbrownlee/Datasets/master/housing.csv'
 df = read_csv(url, header=None)
 data = df.values
 X, y = data[:, :-1], data[:, -1]
 # normalize the target
 scaler = MinMaxScaler()
 y = y.reshape((len(y), 1))
 y = scaler.fit_transform(y)
 return X, y
# evaluate a set of predictions
def evaluate_predictions(y_test, yhat):
 return mean_absolute_error(y_test, yhat)
# create a random set of predictions
def random_predictions(n_examples):
 return [random() for _ in range(n_examples)]
# modify the current set of predictions
def modify_predictions(current, n_changes=1):
 # copy current solution
 updated = current.copy()
 for i in range(n_changes):
  # select a point to change
  ix = randint(0, len(updated)-1)
  # flip the class label
  updated[ix] = random()
 return updated
# run a hill climb for a set of predictions
def hill_climb_testset(X_test, y_test, max_iterations):
scores = list()
# generate the initial solution
solution = random_predictions(X_test.shape[0])
# evaluate the initial solution
score = evaluate_predictions(y_test, solution)
print('>%.3f' % score)
# hill climb to a solution
for i in range(max_iterations):
# record scores
scores.append(score)
# stop once we achieve the best score
if score == 0.0:
 break
# generate new candidate
candidate = modify_predictions(solution)
# evaluate candidate
value = evaluate_predictions(y_test, candidate)
# check if it is as good or better
if value <= score:
 solution, score = candidate, value
 print('>%d, score=%.3f' % (i, score))
return solution, scores
# load the dataset
X, y = load_dataset()
print(X.shape, y.shape)
# split dataset into train and test sets
X_train, X_test, y_train, y_test = train_test_split(X, y, test_size=0.33, random_state=1)
print(X_train.shape, X_test.shape, y_train.shape, y_test.shape)
# run hill climb
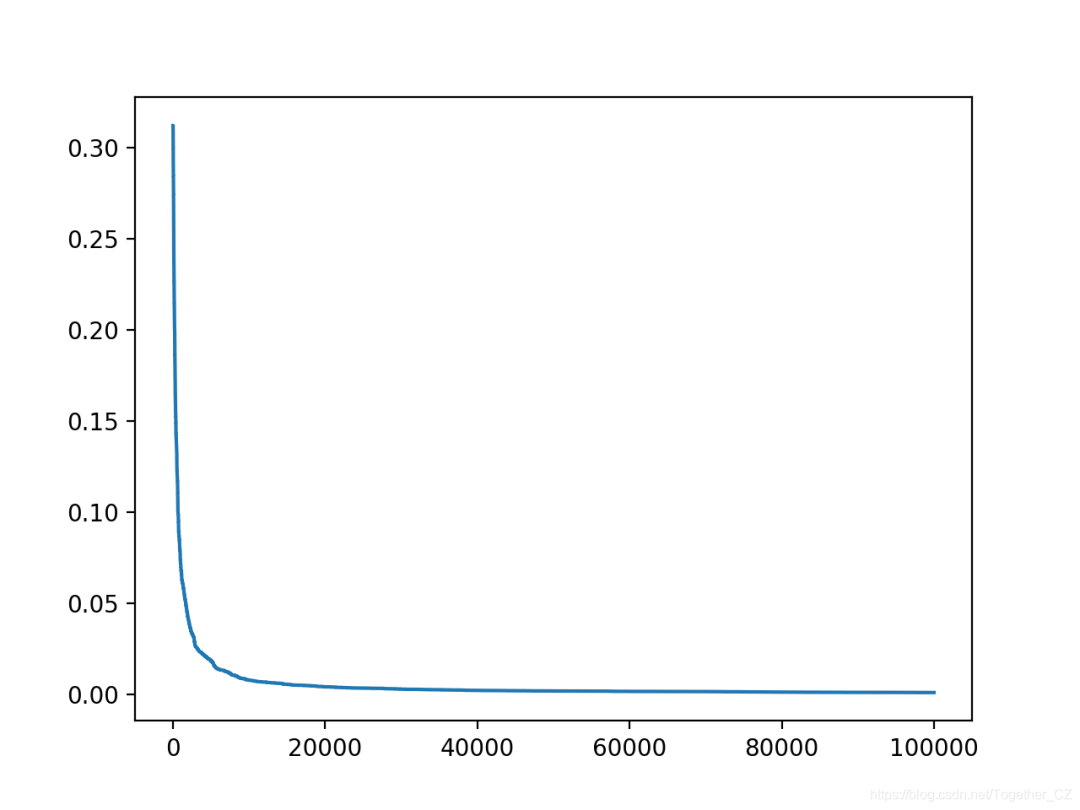
yhat, scores = hill_climb_testset(X_test, y_test, 100000)
# plot the scores vs iterations
pyplot.plot(scores)
pyplot.show()
1e-7)或?qū)δ繕?biāo)域有意義的值,則最好停止操作。這也留給讀者作為練習(xí)。例如:# stop once we achieve a good enough
if score <= 1e-7:
break
>95991, score=0.001
>96011, score=0.001
>96295, score=0.001
>96366, score=0.001
>96585, score=0.001
>97575, score=0.001
>98828, score=0.001
>98947, score=0.001
>99712, score=0.001
>99913, score=0.001
還創(chuàng)建了搜索進(jìn)度的折線圖,顯示收斂速度很快,并且在大多數(shù)迭代中保持不變。
作者:沂水寒城,CSDN博客專家,個(gè)人研究方向:機(jī)器學(xué)習(xí)、深度學(xué)習(xí)、NLP、CV
Blog: http://yishuihancheng.blog.csdn.net
贊 賞 作 者

更多閱讀
特別推薦

點(diǎn)擊下方閱讀原文加入社區(qū)會(huì)員