
用 Python 實(shí)現(xiàn)一個(gè) A/B 測(cè)試!

大家好,我是安果!
A/B 測(cè)試,通過分析兩種不同的營(yíng)銷策略,以此來選擇最佳的營(yíng)銷策略,可以高效地將流量轉(zhuǎn)化為銷售額(或轉(zhuǎn)化為你的預(yù)期目標(biāo))
有助于找到更好的方法來尋找客戶、營(yíng)銷產(chǎn)品、擴(kuò)大影響范圍或?qū)⒛繕?biāo)客戶轉(zhuǎn)化為實(shí)際客戶
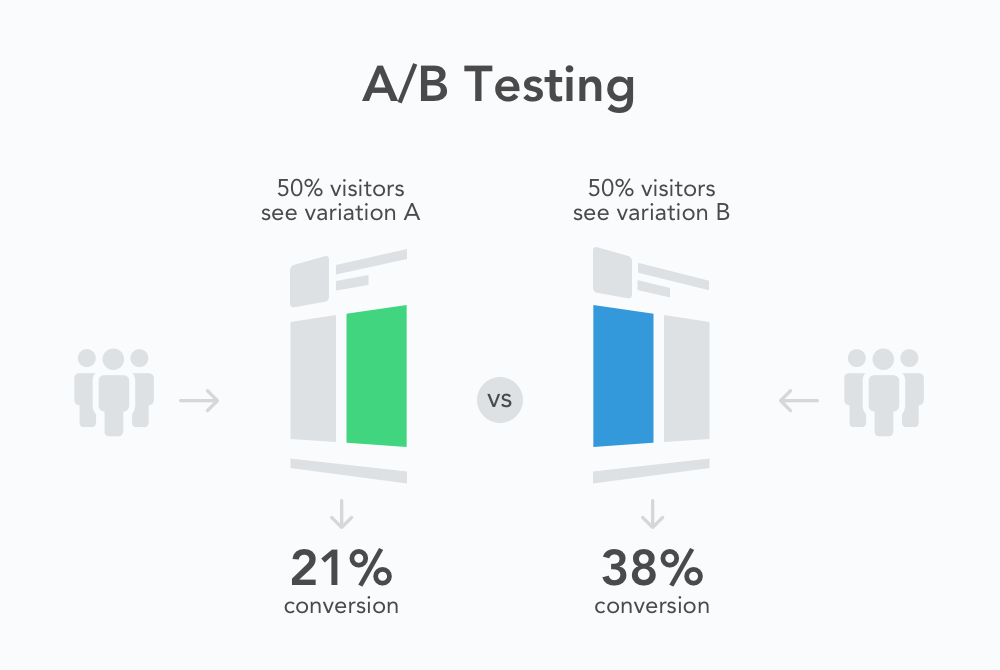 A/B 測(cè)試是每個(gè)學(xué)習(xí)數(shù)據(jù)分析同學(xué),都應(yīng)該知道且去學(xué)習(xí)的概念
/ 01 / AB測(cè)試
舉個(gè)例子,我在短視頻 App 上購買流量推廣我的視頻(掛小黃車買課程),一共推了兩次,其中兩次的目標(biāo)受眾各不相同
在分析了兩次活動(dòng)的結(jié)果后,我可能傾向于選擇第二次的活動(dòng)目標(biāo)受眾,因?yàn)樗鹊谝淮位顒?dòng)能夠帶來更好的銷售額或漲粉或播放量

我們的目標(biāo)可以是提高銷售額、粉絲數(shù)或流量等等
當(dāng)我們根據(jù)以前的營(yíng)銷活動(dòng)結(jié)果選擇最佳的營(yíng)銷策略時(shí),這就是 A/B 測(cè)試
本次使用的數(shù)據(jù)集是開源數(shù)據(jù)集,?LKER YILDIZ在Kaggle上提交的A/B測(cè)試的數(shù)據(jù)集
下面是數(shù)據(jù)集中的所有特征:
1. Campaign Name: 活動(dòng)名稱
2. Date: 記錄日期
3. Spend: 活動(dòng)花費(fèi)(單位:美元)
4. of Impressions: 廣告在整個(gè)活動(dòng)中的展示次數(shù)
5. Reach: 廣告在整個(gè)活動(dòng)中的展示人數(shù)(唯一)
6. of Website Clicks: 通過廣告獲得的網(wǎng)站點(diǎn)擊次數(shù)
7. of Searches: 在網(wǎng)站上執(zhí)行搜索的用戶數(shù)量
8. of View Content: 查看網(wǎng)站內(nèi)容產(chǎn)品的用戶數(shù)量
9. of Add to Cart: 將產(chǎn)品添加到購物車的用戶數(shù)量
10. of Purchase: 購買次數(shù)
一共是進(jìn)行了兩種類型的宣傳營(yíng)銷活動(dòng):
1. Control Campaign: 對(duì)照活動(dòng)
2. Test Campaign: 測(cè)試活動(dòng)
通過執(zhí)行A/B測(cè)試找到最適合的營(yíng)銷策略,以此來吸引獲得更多的客戶。
下面小F就帶大家一起來學(xué)習(xí)下
/ 02 / 使用Python進(jìn)行AB測(cè)試
先安裝相關(guān)的Python可視化庫plotly,在使用的時(shí)候發(fā)現(xiàn)報(bào)錯(cuò),所以還要安裝statsmodels庫。
pip install -i https://pypi.tuna.tsinghua.edu.cn/simple statsmodels
pip install -i https://pypi.tuna.tsinghua.edu.cn/simple plotly
然后導(dǎo)入Python庫,讀取兩種活動(dòng)的數(shù)據(jù)文件。
import pandas as pd
import datetime
from datetime import date, timedelta
import plotly.graph_objects as go
import plotly.express as px
import plotly.io as pio
pio.templates.default = "plotly_white"
# 設(shè)置value的顯示長(zhǎng)度為200,默認(rèn)為50
pd.set_option('max_colwidth', 300)
# 顯示所有列,把行顯示設(shè)置成最大
pd.set_option('display.max_columns', None)
# 顯示所有行,把列顯示設(shè)置成最大
pd.set_option('display.max_rows', None)
# 加載數(shù)據(jù)
control_data = pd.read_csv("control_group.csv", sep=";")
test_data = pd.read_csv("test_group.csv", sep=";")
來看看這兩個(gè)數(shù)據(jù)集的情況。
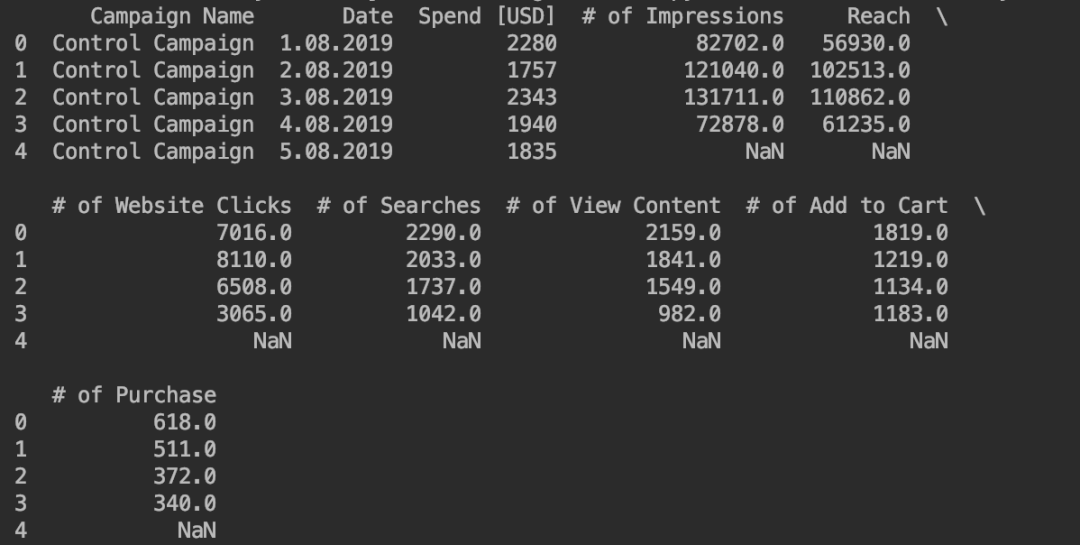
# 打印對(duì)照活動(dòng)數(shù)據(jù)
print(control_data.head())
對(duì)照活動(dòng)數(shù)據(jù)的情況如下。
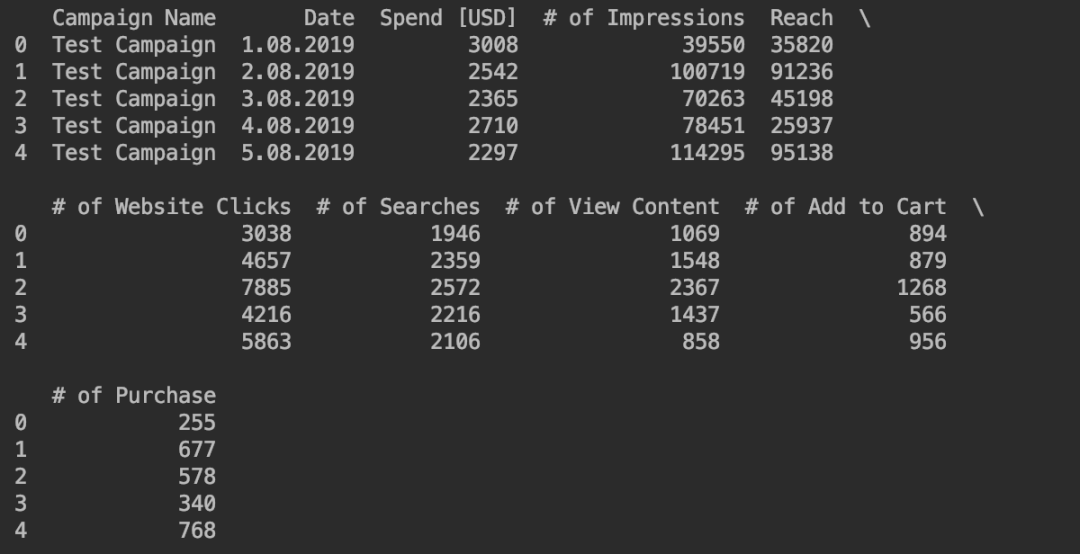
打印測(cè)試活動(dòng)數(shù)據(jù)。
# 打印測(cè)試活動(dòng)數(shù)據(jù)
print(test_data.head())
測(cè)試活動(dòng)數(shù)據(jù)的情況如下。
/ 03 / 數(shù)據(jù)準(zhǔn)備
發(fā)現(xiàn)數(shù)據(jù)集的列名不太規(guī)范,所以對(duì)列名進(jìn)行修改。
# 更改列名
control_data.columns = ["Campaign Name", "Date", "Amount Spent",
"Number of Impressions", "Reach", "Website Clicks",
"Searches Received", "Content Viewed", "Added to Cart",
"Purchases"]
test_data.columns = ["Campaign Name", "Date", "Amount Spent",
"Number of Impressions", "Reach", "Website Clicks",
"Searches Received", "Content Viewed", "Added to Cart",
"Purchases"]
現(xiàn)在讓我們看看數(shù)據(jù)集是否有空值。
# 查看空值
print(control_data.isnull().sum())
print(test_data.isnull().sum())


發(fā)現(xiàn)對(duì)照活動(dòng)的數(shù)據(jù)集有數(shù)據(jù)缺失,可以用每列的平均值來填充這些缺失值。
# 數(shù)據(jù)清洗
control_data["Number of Impressions"].fillna(value=control_data["Number of Impressions"].mean(),
inplace=True)
control_data["Reach"].fillna(value=control_data["Reach"].mean(),
inplace=True)
control_data["Website Clicks"].fillna(value=control_data["Website Clicks"].mean(),
inplace=True)
control_data["Searches Received"].fillna(value=control_data["Searches Received"].mean(),
inplace=True)
control_data["Content Viewed"].fillna(value=control_data["Content Viewed"].mean(),
inplace=True)
control_data["Added to Cart"].fillna(value=control_data["Added to Cart"].mean(),
inplace=True)
control_data["Purchases"].fillna(value=control_data["Purchases"].mean(),
inplace=True)
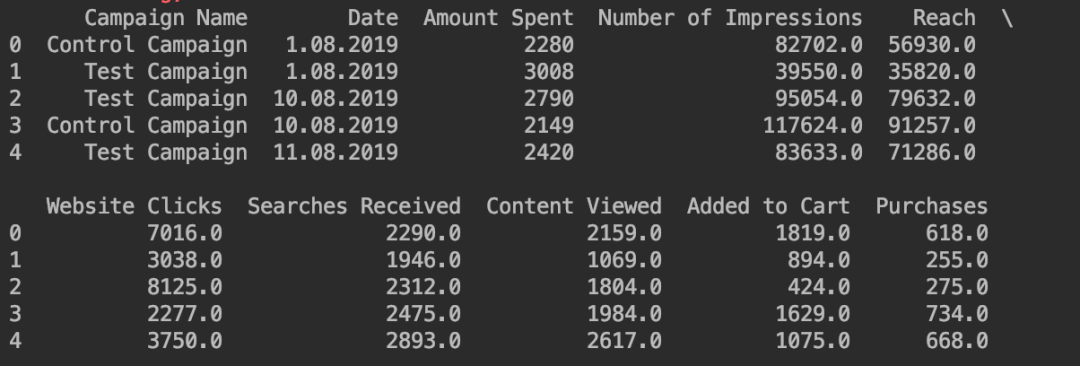
通過合并兩個(gè)數(shù)據(jù)集來創(chuàng)建一個(gè)新的數(shù)據(jù)集。
# 合并數(shù)據(jù)
ab_data = control_data.merge(test_data,
how="outer").sort_values(["Date"])
ab_data = ab_data.reset_index(drop=True)
print(ab_data.head())
查看數(shù)據(jù)集中,兩種活動(dòng)的樣本數(shù)量是否相同。
# 類型計(jì)數(shù)
print(ab_data["Campaign Name"].value_counts())

可以看出,每種活動(dòng)都有30個(gè)樣本數(shù)據(jù),滿足樣本均衡的條件。
/ 04 / AB測(cè)試找到最佳營(yíng)銷策略
01 展示次數(shù)-活動(dòng)花費(fèi)
首先分析兩種活動(dòng)中「展示次數(shù)」和「活動(dòng)花費(fèi)」之間的關(guān)系。
figure = px.scatter(data_frame = ab_data,
x="Number of Impressions",
y="Amount Spent",
size="Amount Spent",
color= "Campaign Name",
trendline="ols")
figure.show()
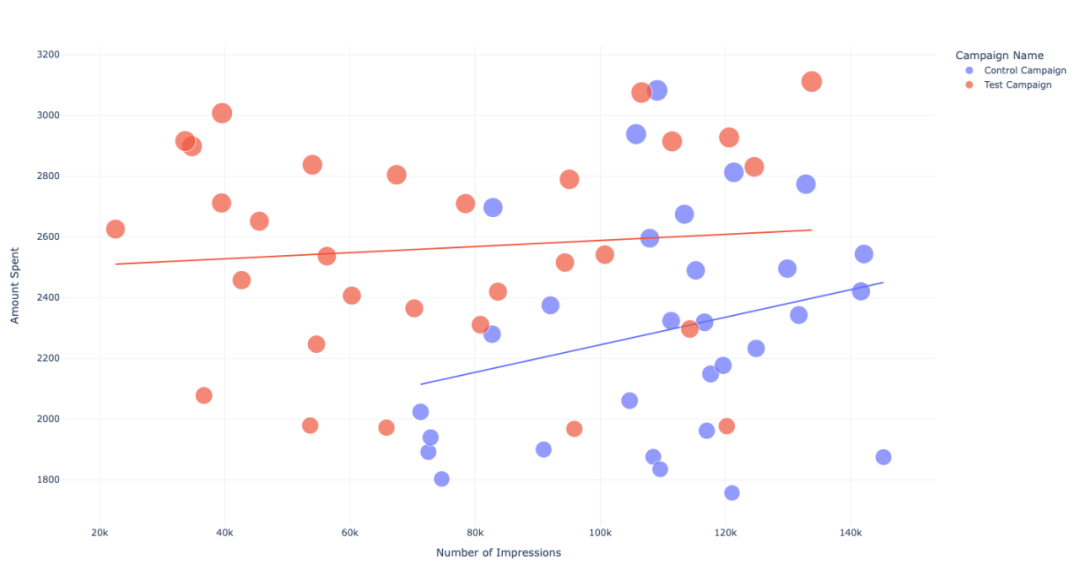
發(fā)現(xiàn)在花費(fèi)相同的情況下,「 對(duì)照活動(dòng) 」的展示次數(shù)更多。
02 搜索量
兩種類型活動(dòng)的網(wǎng)站總搜索量對(duì)比。
label = ["Total Searches from Control Campaign",
"Total Searches from Test Campaign"]
counts = [sum(control_data["Searches Received"]),
sum(test_data["Searches Received"])]
colors = ['gold', 'lightgreen']
fig = go.Figure(data=[go.Pie(labels=label, values=counts)])
fig.update_layout(title_text='Control Vs Test: Searches')
fig.update_traces(hoverinfo='label+percent', textinfo='value',
textfont_size=30,
marker=dict(colors=colors,
line=dict(color='black', width=3)))
fig.show()
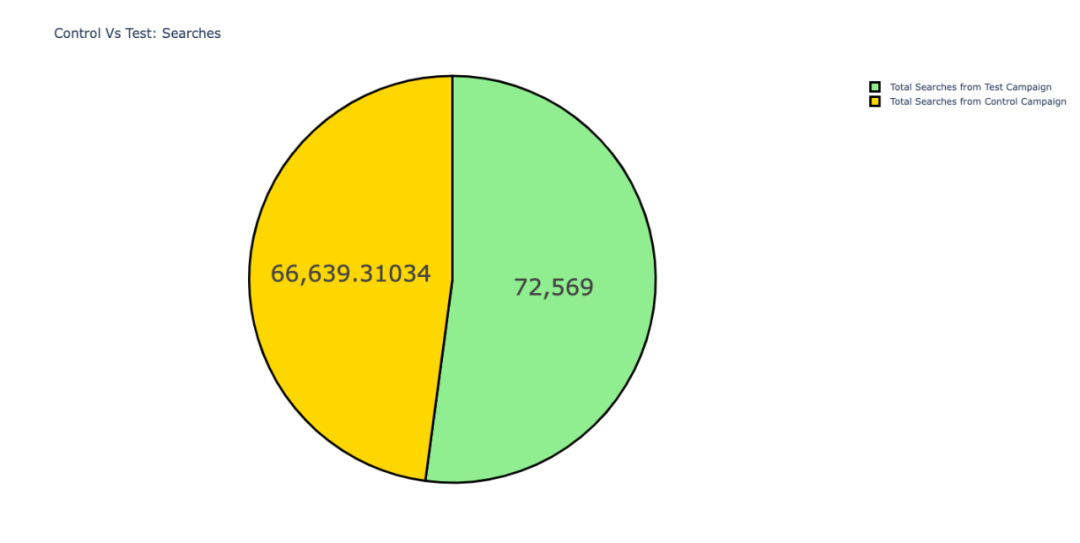
在網(wǎng)站的搜索量上,「 測(cè)試活動(dòng) 」略多于對(duì)照活動(dòng)。
03 點(diǎn)擊量
兩種類型活動(dòng)的網(wǎng)站總點(diǎn)擊量對(duì)比。
label = ["Website Clicks from Control Campaign",
"Website Clicks from Test Campaign"]
counts = [sum(control_data["Website Clicks"]),
sum(test_data["Website Clicks"])]
colors = ['gold', 'lightgreen']
fig = go.Figure(data=[go.Pie(labels=label, values=counts)])
fig.update_layout(title_text='Control Vs Test: Website Clicks')
fig.update_traces(hoverinfo='label+percent', textinfo='value',
textfont_size=30,
marker=dict(colors=colors,
line=dict(color='black', width=3)))
fig.show()
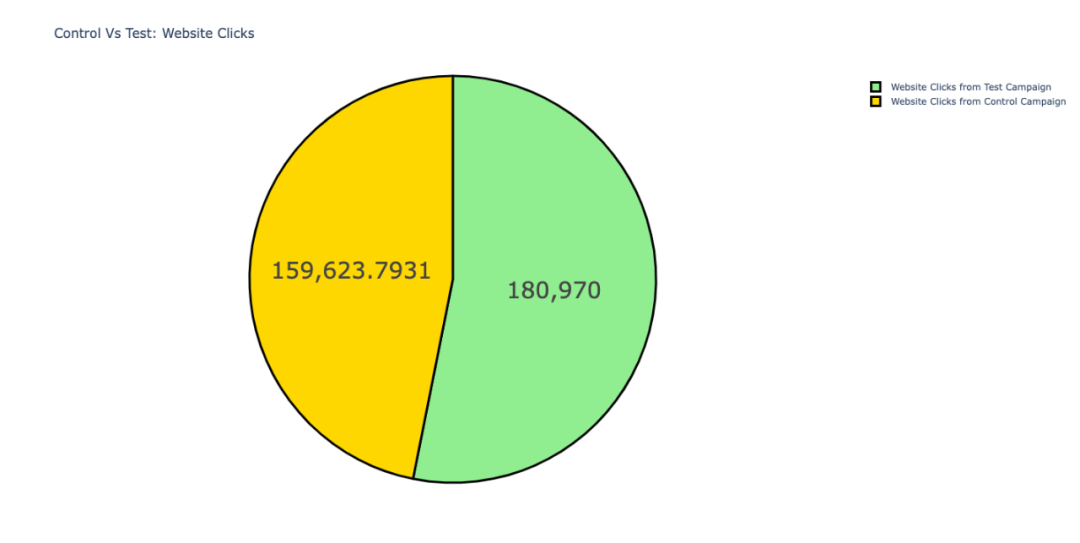
在網(wǎng)站的點(diǎn)擊量上,「 測(cè)試活動(dòng) 」略多于對(duì)照活動(dòng)。
04 內(nèi)容產(chǎn)品查看量
兩種類型活動(dòng)的網(wǎng)站內(nèi)容和產(chǎn)品的查看量對(duì)比。
label = ["Content Viewed from Control Campaign",
"Content Viewed from Test Campaign"]
counts = [sum(control_data["Content Viewed"]),
sum(test_data["Content Viewed"])]
colors = ['gold', 'lightgreen']
fig = go.Figure(data=[go.Pie(labels=label, values=counts)])
fig.update_layout(title_text='Control Vs Test: Content Viewed')
fig.update_traces(hoverinfo='label+percent', textinfo='value',
textfont_size=30,
marker=dict(colors=colors,
line=dict(color='black', width=3)))
fig.show()
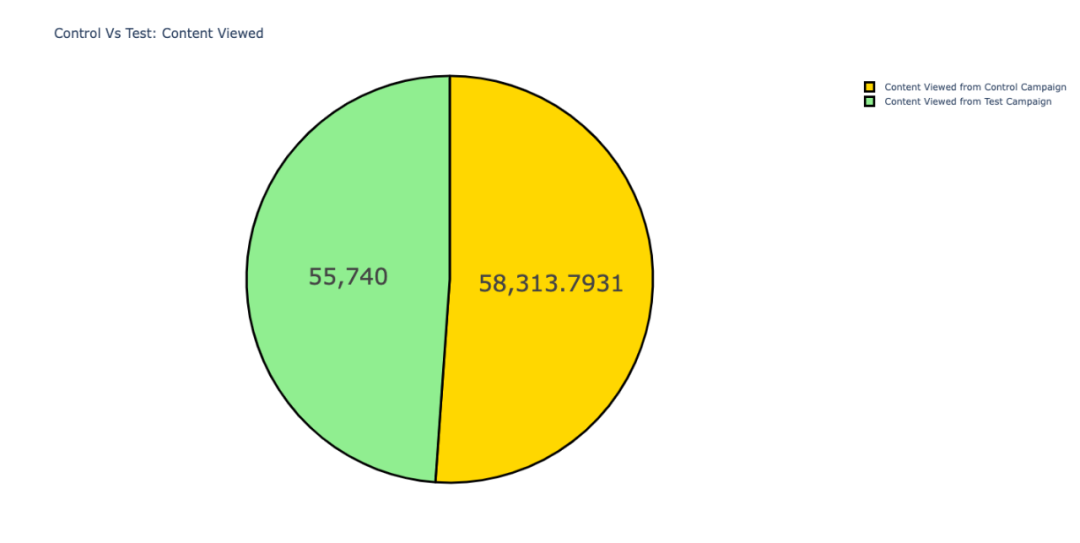
可以看出「 對(duì)照活動(dòng) 」的 內(nèi)容產(chǎn)品查看量比測(cè)試活動(dòng)多 。
雖然差距不是很大,但是由于對(duì)照活動(dòng)的網(wǎng)站點(diǎn)擊率相對(duì)較低,這便意味著 「對(duì)照活動(dòng) 」 的用戶參與度(粘性)高于測(cè)試活動(dòng)。
05 加購物車量
兩種類型活動(dòng),將產(chǎn)品添加到購物車的數(shù)量。
label = ["Products Added to Cart from Control Campaign",
"Products Added to Cart from Test Campaign"]
counts = [sum(control_data["Added to Cart"]),
sum(test_data["Added to Cart"])]
colors = ['gold','lightgreen']
fig = go.Figure(data=[go.Pie(labels=label, values=counts)])
fig.update_layout(title_text='Control Vs Test: Added to Cart')
fig.update_traces(hoverinfo='label+percent', textinfo='value',
textfont_size=30,
marker=dict(colors=colors,
line=dict(color='black', width=3)))
fig.show()
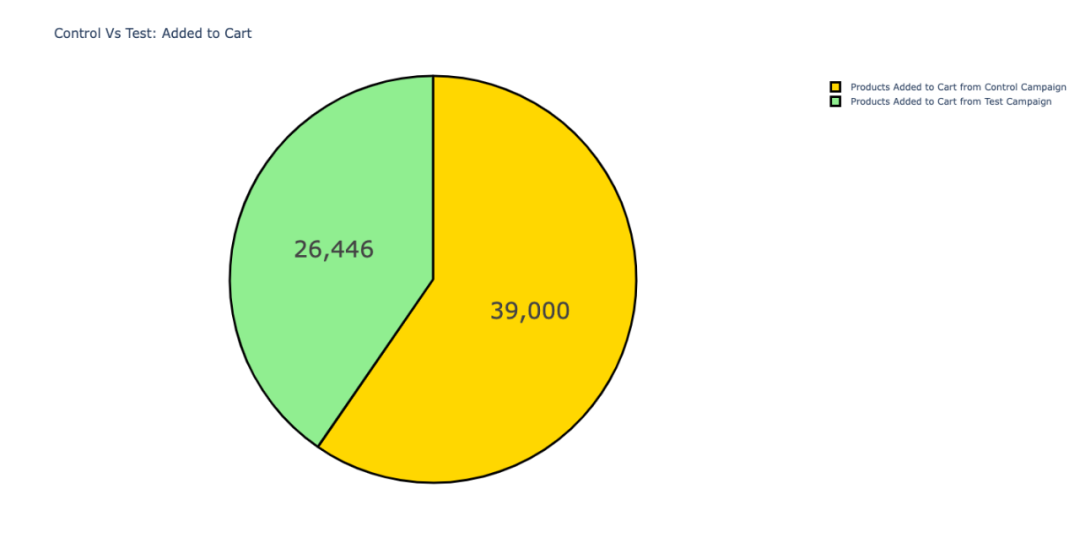
盡管「 對(duì)照活動(dòng) 」的點(diǎn)擊率相對(duì)較低,但是卻有更多的產(chǎn)品被添加到購物車中。
06 活動(dòng)花費(fèi)
兩種類型的活動(dòng)花費(fèi)對(duì)比。
label = ["Amount Spent in Control Campaign",
"Amount Spent in Test Campaign"]
counts = [sum(control_data["Amount Spent"]),
sum(test_data["Amount Spent"])]
colors = ['gold','lightgreen']
fig = go.Figure(data=[go.Pie(labels=label, values=counts)])
fig.update_layout(title_text='Control Vs Test: Amount Spent')
fig.update_traces(hoverinfo='label+percent', textinfo='value',
textfont_size=30,
marker=dict(colors=colors,
line=dict(color='black', width=3)))
fig.show()
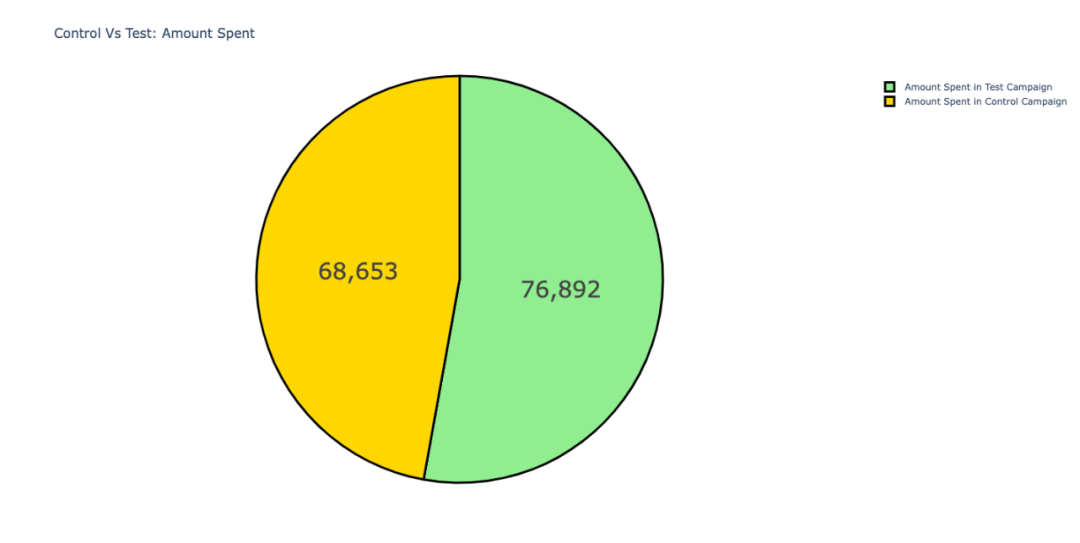
在測(cè)試活動(dòng)上的花費(fèi)要高于對(duì)照活動(dòng)。
基于上面的分析,對(duì)照活動(dòng)帶來了更多的內(nèi)容瀏覽量和產(chǎn)品添加到購物車, 「對(duì)照活動(dòng)」 比測(cè)試活動(dòng)更有效。
07 銷售額
兩種類型活動(dòng)的銷售情況對(duì)比。
label = ["Purchases Made by Control Campaign",
"Purchases Made by Test Campaign"]
counts = [sum(control_data["Purchases"]),
sum(test_data["Purchases"])]
colors = ['gold','lightgreen']
fig = go.Figure(data=[go.Pie(labels=label, values=counts)])
fig.update_layout(title_text='Control Vs Test: Purchases')
fig.update_traces(hoverinfo='label+percent', textinfo='value',
textfont_size=30,
marker=dict(colors=colors,
line=dict(color='black', width=3)))
fig.show()
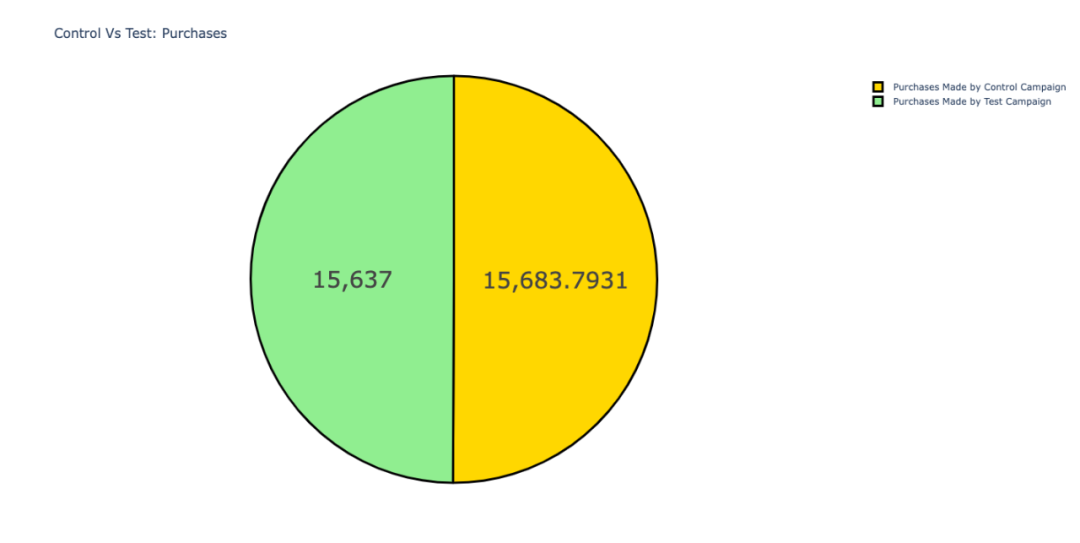
在這兩種廣告活動(dòng)當(dāng)中,消費(fèi)者的購買量?jī)H相差1%左右。
由于對(duì)照活動(dòng)能以更少的營(yíng)銷支出獲得了更多的銷售,所以在營(yíng)銷策略上,我們可以選擇對(duì)照活動(dòng)類型。
最后讓我們分析其它指標(biāo),看看哪種廣告活動(dòng)的轉(zhuǎn)化率更高。
08 內(nèi)容產(chǎn)品查看量和點(diǎn)擊量
兩種類型活動(dòng)網(wǎng)站內(nèi)容查看和點(diǎn)擊量 的關(guān)系。
figure = px.scatter(data_frame=ab_data,
x="Content Viewed",
y="Website Clicks",
size="Website Clicks",
color="Campaign Name",
trendline="ols")
figure.show()
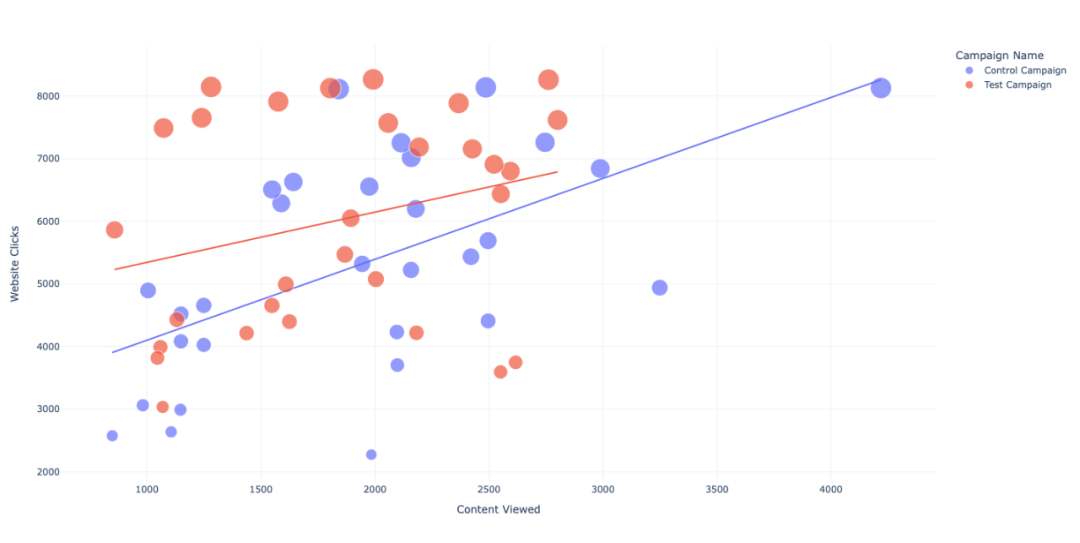
在測(cè)試活動(dòng)中,雖然網(wǎng)站點(diǎn)擊率高,但是內(nèi)容查看量少,所以優(yōu)先選擇「對(duì)照活動(dòng)」。
09 內(nèi)容產(chǎn)品查看量和添加購物車
分析網(wǎng)站內(nèi)容查看和添加購物車之間的關(guān)系。
figure = px.scatter(data_frame=ab_data,
x="Added to Cart",
y="Content Viewed",
size="Added to Cart",
color="Campaign Name",
trendline="ols")
figure.show()
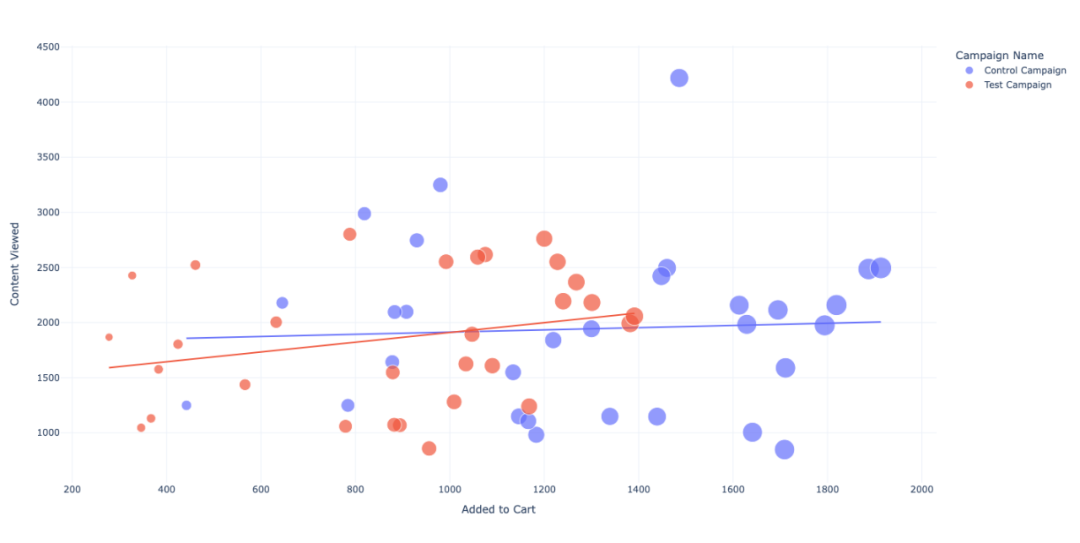
再一次的,「對(duì)照活動(dòng)」的效果還是很好,加入購物車的意向較高。
10 添加購物車和銷售額
分析添加到購物車的產(chǎn)品數(shù)量和銷售額之間的關(guān)系。
figure = px.scatter(data_frame=ab_data,
x="Purchases",
y="Added to Cart",
size="Purchases",
color="Campaign Name",
trendline="ols")
figure.show()
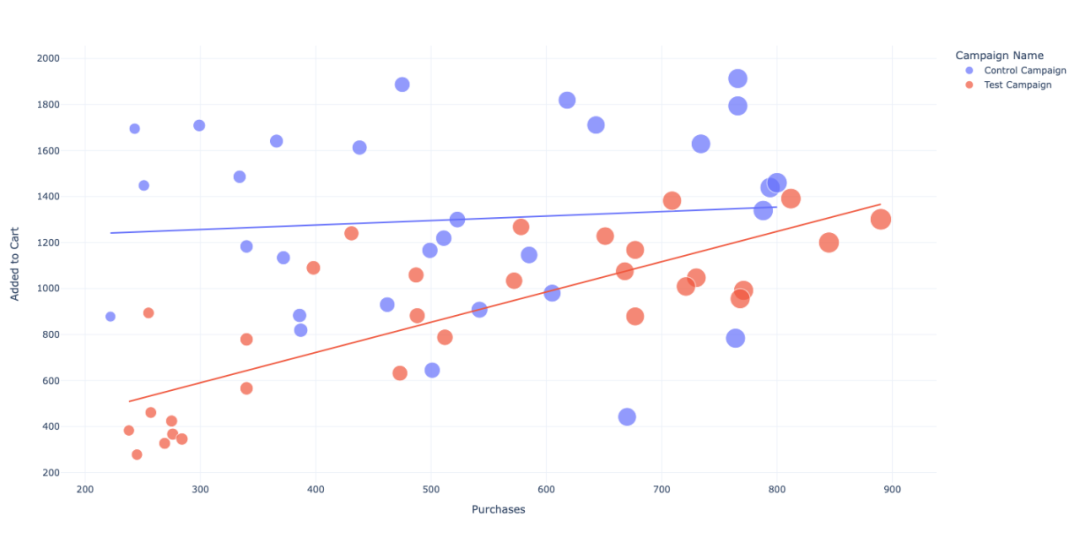
雖然對(duì)照活動(dòng)帶來了更多的加購物車行為,但「測(cè)試活動(dòng)」的結(jié)算率會(huì)更高。
/ 05 / 結(jié)論
通過A/B測(cè)試,我們發(fā)現(xiàn)對(duì)照活動(dòng)帶來了更多的銷售行為和訪問者的參與。
用戶會(huì)從對(duì)照活動(dòng)中查看了更多的產(chǎn)品,使得購物車中有更多的產(chǎn)品和更多的銷售額。
但在測(cè)試活動(dòng)中,用戶購物車產(chǎn)品的結(jié)算 率會(huì)更高。
測(cè)試活動(dòng)是根據(jù)內(nèi)容查看和添加到購物車會(huì)有更多的銷售。而對(duì)照活動(dòng)則是整體銷量的增加。
因此,測(cè)試活動(dòng)可以用來向特定的受眾推銷特定的產(chǎn)品,而對(duì)照活動(dòng)可以用來向更廣泛的客戶推銷多種產(chǎn)品