
Spring Boot 應(yīng)用可視化監(jiān)控,一目了然!
關(guān)注我們,設(shè)為星標,每天7:30不見不散,架構(gòu)路上與您共享 回復(fù)"架構(gòu)師"獲取資源
來自:CSDN,作者:你照亮了我的世界
鏈接:https://blog.csdn.net/weixin_44196699/article/details/105010045
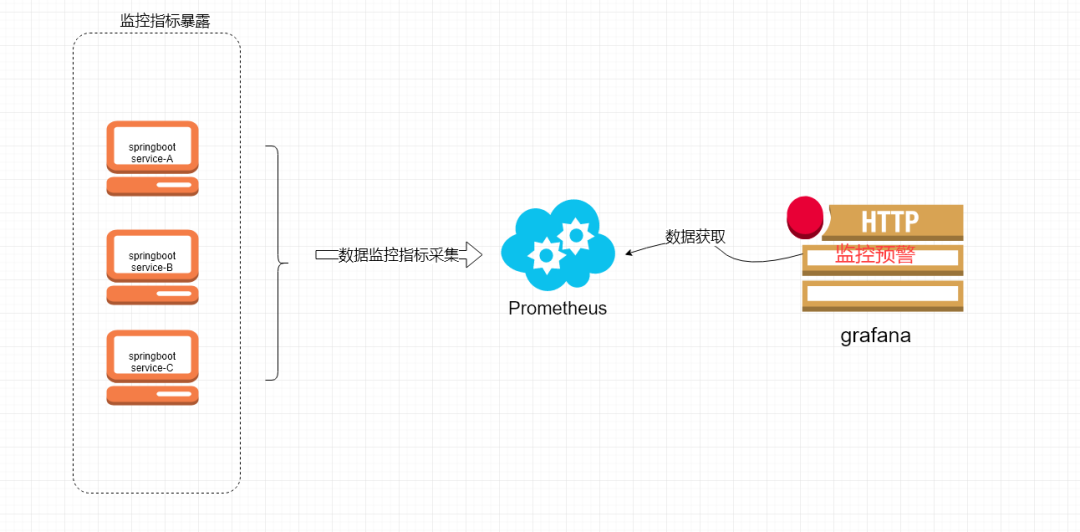
1、Spring Boot 應(yīng)用暴露監(jiān)控指標【版本 1.5.7.RELEASE】
首先,添加依賴如下依賴:
<dependency>
   <groupId>org.springframework.boot</groupId>
   <artifactId>spring-boot-starter-actuator</artifactId>
</dependency>
采集應(yīng)用的指標信息,我們使用的是prometheus,相應(yīng)的我們引入包:
<dependency>
  <groupId>io.prometheus</groupId>
  <artifactId>simpleclient_spring_boot</artifactId>                     <version>0.0.26</version>
</dependency>
然后,在啟動類 Application.java 添加如下注解:
@SpringBootApplication
@EnablePrometheusEndpoint
@EnableSpringBootMetricsCollector
public class Application {
    public static void main(String[] args) {        SpringApplication.run(Application.class, args);
 }
}
最后,配置默認的登錄賬號和密碼,在 application.yml 中:
security:
  user:
    name:user
    password: pwd
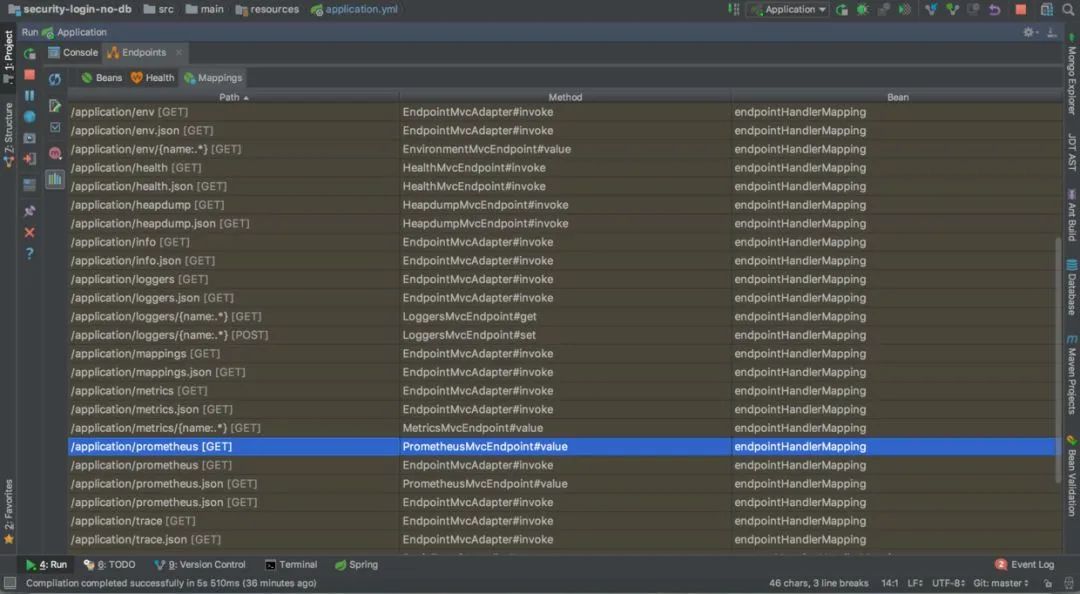
啟動應(yīng)用程序后,會看到如下一系列的 Mappings
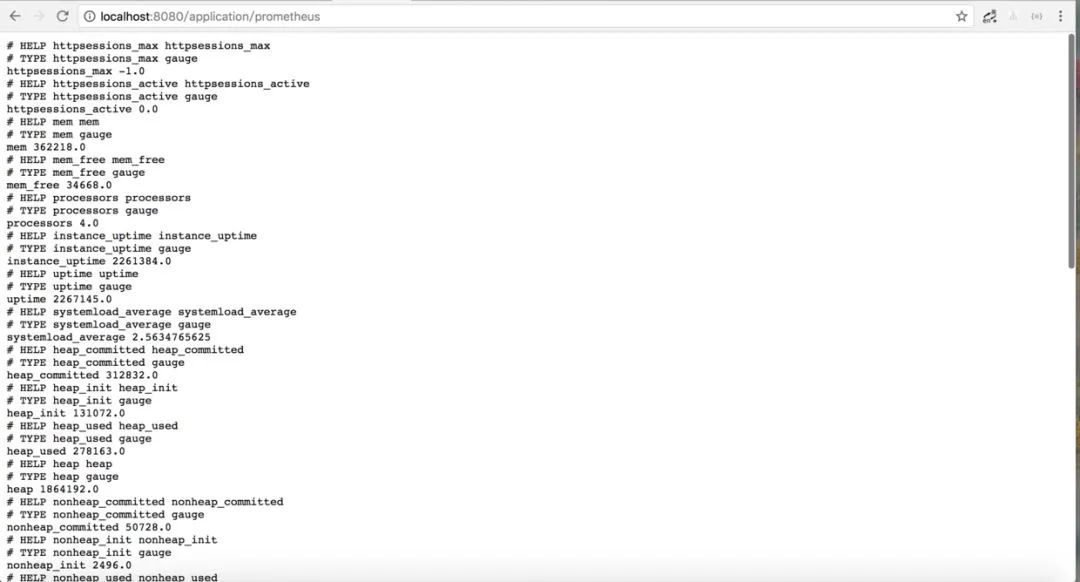
利用賬號密碼訪問 http://localhost:8080/application/prometheus ,可以看到 Prometheus 格式的指標數(shù)據(jù)
2、Prometheus 采集 Spring Boot 指標數(shù)據(jù)
首先,獲取 Prometheus 的 Docker 鏡像:
$ docker pull prom/prometheus
然后,編寫配置文件 prometheus.yml :
global:
  scrape_interval: 10s
  scrape_timeout: 10s
  evaluation_interval: 10m
scrape_configs:
  - job_name: spring-boot
    scrape_interval: 5s
    scrape_timeout: 5s
    metrics_path: /application/prometheus
    scheme: http
    basic_auth:
      username: admin
      password: 123456
    static_configs:
      - targets:
        - 192.168.11.54:8099 #此處填寫 Spring Boot 應(yīng)用的 IP + 端口號
接著,啟動 Prometheus :
docker run -d --name prometheus -p 9090:9090
-v D:\test\actuator\prometheus\prometheus.yml:/etc/prometheus/prometheus.yml prom/prometheus
請注意,
D:\test\actuator\prometheus\prometheus.yml,是我的配置文件存放地址,我們需要將它放到容器里面去,所以用了-v來做文件映射。/etc/prometheus/prometheus.yml這個是容器啟動的時候去取的默認配置,這里我是直接覆蓋掉了它。prom/prometheus這是鏡像,如果本地沒有,就回去你設(shè)置好的鏡像倉庫去取。
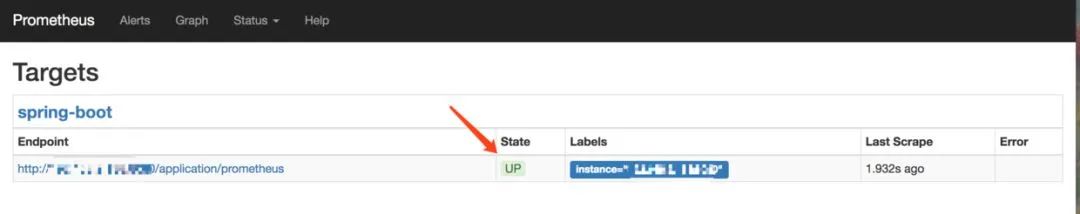
啟動完成后用**docker ps**看下是否已經(jīng)啟動成功,之后打開瀏覽器輸入:http://localhost:9090/targets,檢查 Spring Boot 采集狀態(tài)是否正常,如果看到下圖就是成功了。
3、Grafana 可視化監(jiān)控數(shù)據(jù)
首先,獲取 Grafana 的 Docker 鏡像:
$ docker pull grafana/grafana1
然后,啟動 Grafana:
$ docker run --name grafana -d -p 3000:3000 grafana/grafana1
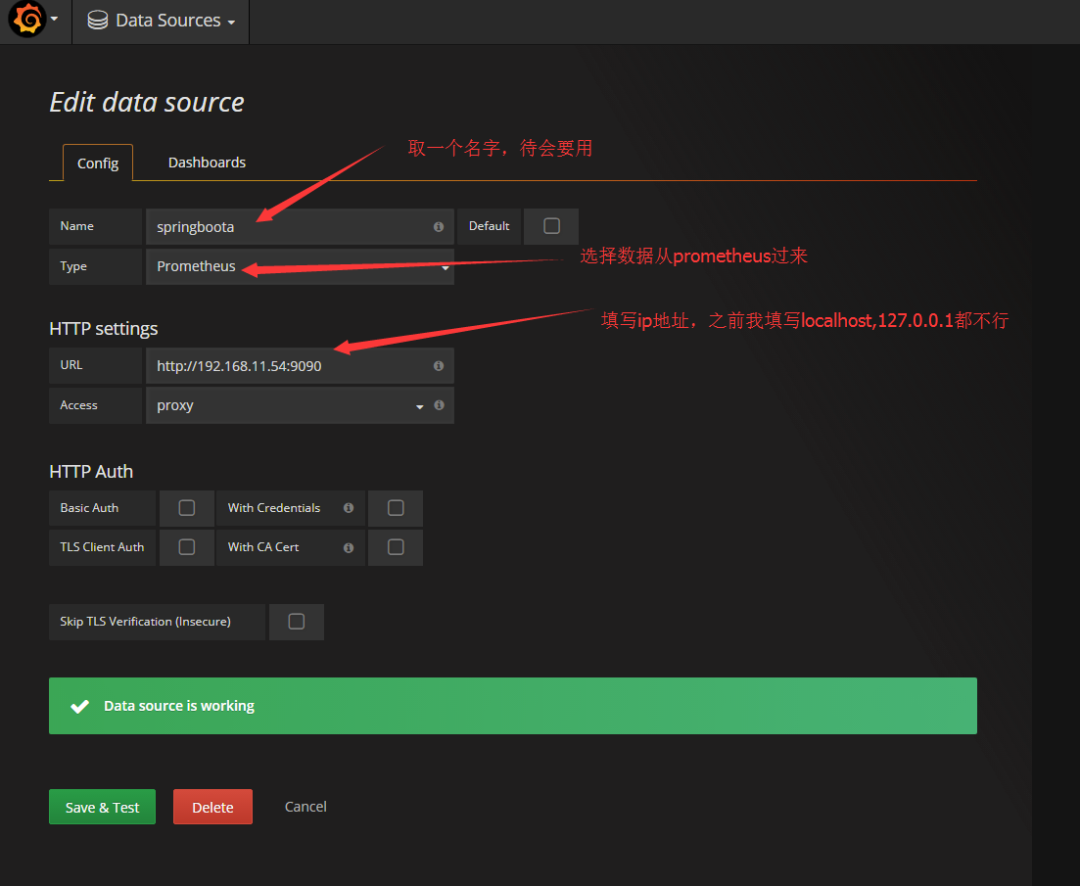
接著,訪問 http://localhost:3000/ 配置 Prometheus 數(shù)據(jù)源:
Grafana 登錄賬號 admin 密碼 admin
先配置數(shù)據(jù)源.
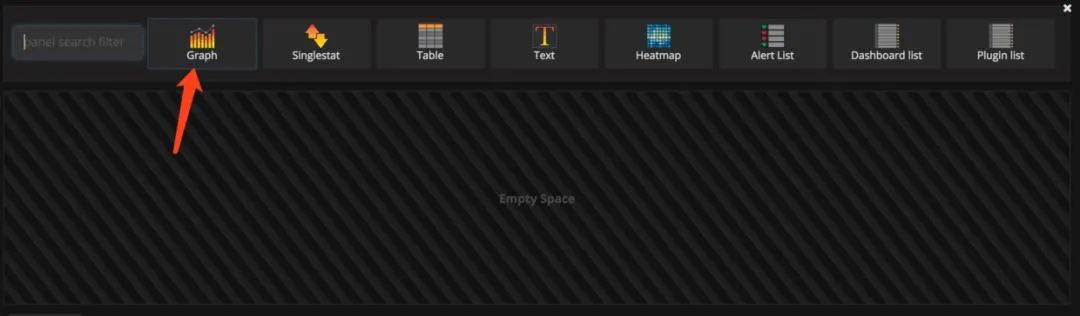
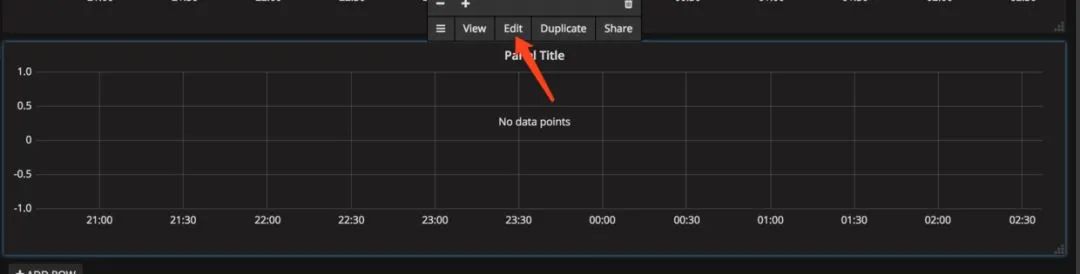
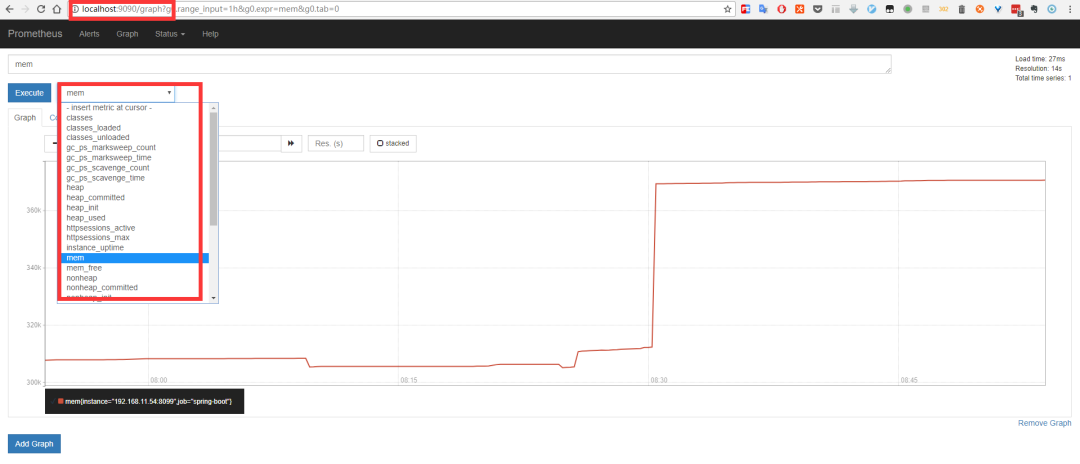
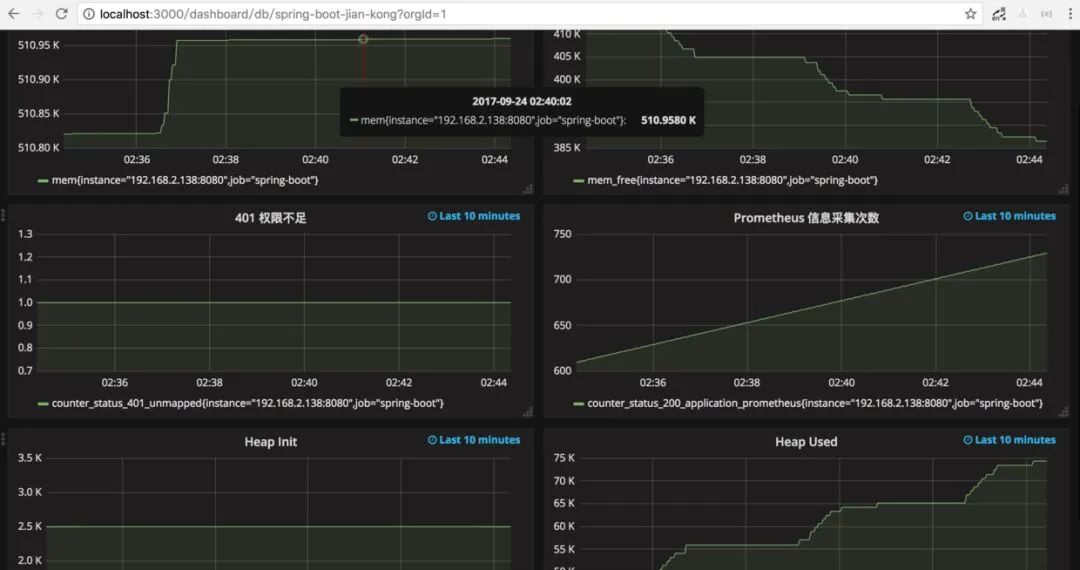
2.配置單個指標的可視化監(jiān)控面板:
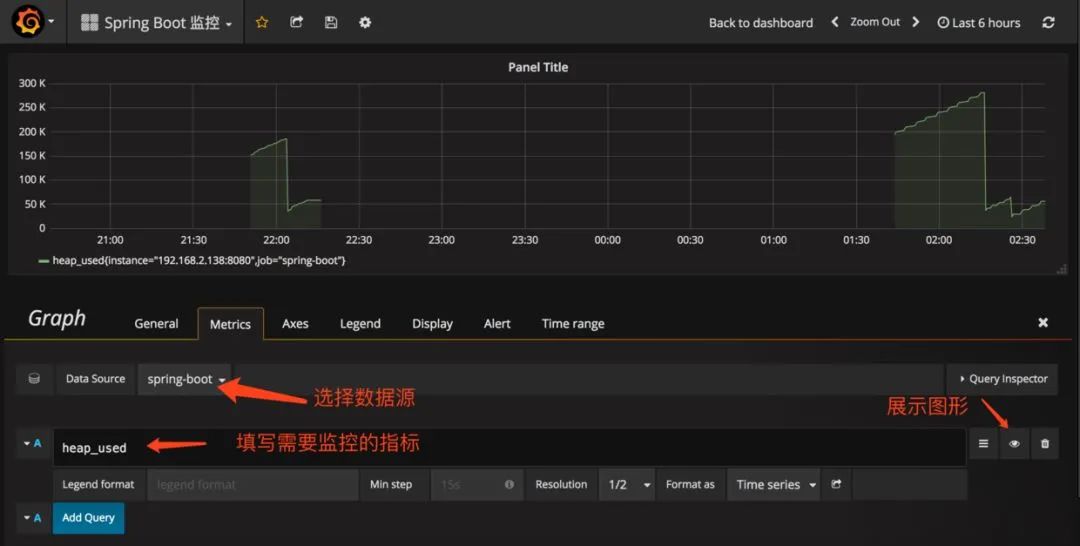
prometh采集的數(shù)據(jù)

到此文章就結(jié)束了。如果今天的文章對你在進階架構(gòu)師的路上有新的啟發(fā)和進步,歡迎轉(zhuǎn)發(fā)給更多人。歡迎加入架構(gòu)師社區(qū)技術(shù)交流群,眾多大咖帶你進階架構(gòu)師,在后臺回復(fù)“加群”即可入群。
這些年小編給你分享過的干貨
1.SpringBoot物流管理項目,拿去學(xué)習(xí)吧(附源碼)
2.ERP系統(tǒng),自帶進銷存+財務(wù)+生產(chǎn)功能,拿來即用(附源碼)
3.帶工作流的SpringBoot后臺管理項目快速開發(fā)(附源碼)
4.最好的OA系統(tǒng),拿來即用,非常方便(附源碼)
5.SpringBoot+Vue完整的外賣系統(tǒng),手機端和后臺管理,附源碼!
6.SpringBoot+Vue 可視化拖拽編輯的大屏項目(附源碼)

轉(zhuǎn)發(fā)在看就是最大的支持??