Spring Boot 應(yīng)用可視化監(jiān)控,一目了然!
點擊關(guān)注公眾號,Java干貨及時送達(dá)
真香!24W字的Java面試手冊(點擊查看)
1、Spring Boot 應(yīng)用暴露監(jiān)控指標(biāo)【版本 1.5.7.RELEASE】

<dependency>
   <groupId>org.springframework.boot</groupId>
   <artifactId>spring-boot-starter-actuator</artifactId>
</dependency>
采集應(yīng)用的指標(biāo)信息,我們使用的是prometheus,相應(yīng)的我們引入包:
<dependency>
  <groupId>io.prometheus</groupId>
  <artifactId>simpleclient_spring_boot</artifactId>                     <version>0.0.26</version>
</dependency>
然后,在啟動類 Application.java 添加如下注解:
@SpringBootApplication
@EnablePrometheusEndpoint
@EnableSpringBootMetricsCollector
public class Application {
    public static void main(String[] args) {        SpringApplication.run(Application.class, args);
 }
}
最后,配置默認(rèn)的登錄賬號和密碼,在 application.yml 中:
security:
  user:
    name:user
    password: pwd
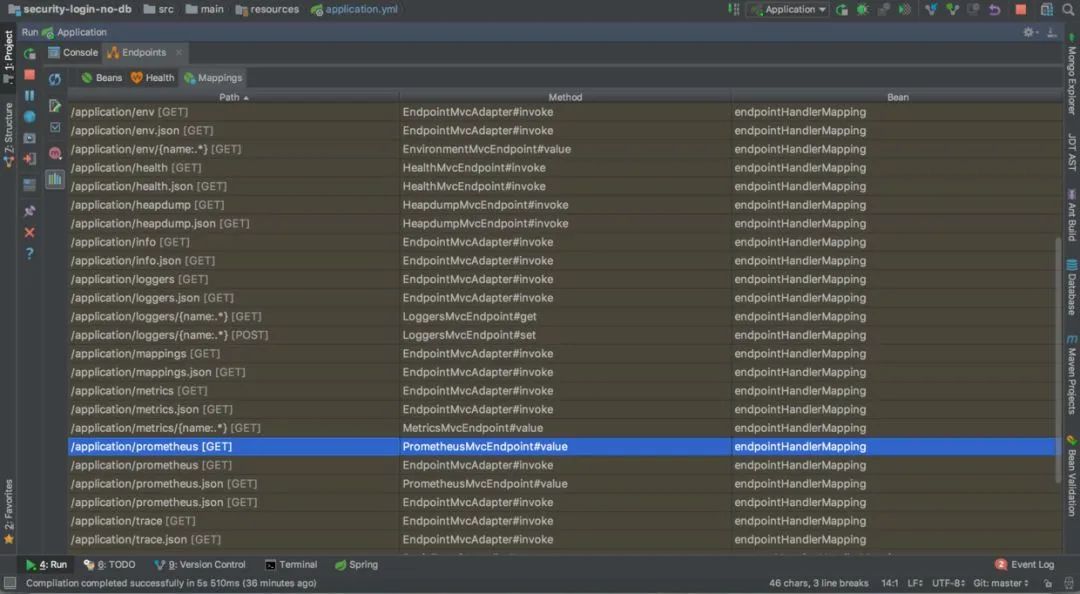
啟動應(yīng)用程序后,會看到如下一系列的 Mappings
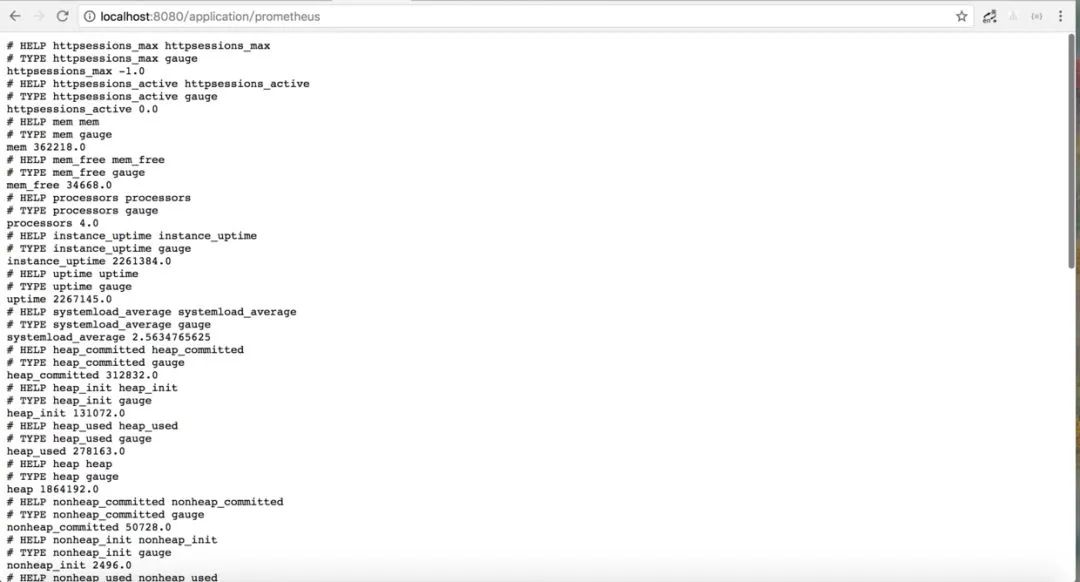
利用賬號密碼訪問 http://localhost:8080/application/prometheus ,可以看到 Prometheus 格式的指標(biāo)數(shù)據(jù)
2、Prometheus 采集 Spring Boot 指標(biāo)數(shù)據(jù)
$ docker pull prom/prometheus
然后,編寫配置文件 prometheus.yml :
global:
  scrape_interval: 10s
  scrape_timeout: 10s
  evaluation_interval: 10m
scrape_configs:
  - job_name: spring-boot
    scrape_interval: 5s
    scrape_timeout: 5s
    metrics_path: /application/prometheus
    scheme: http
    basic_auth:
      username: admin
      password: 123456
    static_configs:
      - targets:
        - 192.168.11.54:8099 #此處填寫 Spring Boot 應(yīng)用的 IP + 端口號
接著,啟動 Prometheus :
docker run -d --name prometheus -p 9090:9090
-v D:\test\actuator\prometheus\prometheus.yml:/etc/prometheus/prometheus.yml prom/prometheus
請注意,
D:\test\actuator\prometheus\prometheus.yml,是我的配置文件存放地址,我們需要將它放到容器里面去,所以用了-v來做文件映射。/etc/prometheus/prometheus.yml這個是容器啟動的時候去取的默認(rèn)配置,這里我是直接覆蓋掉了它。prom/prometheus這是鏡像,如果本地沒有,就回去你設(shè)置好的鏡像倉庫去取。
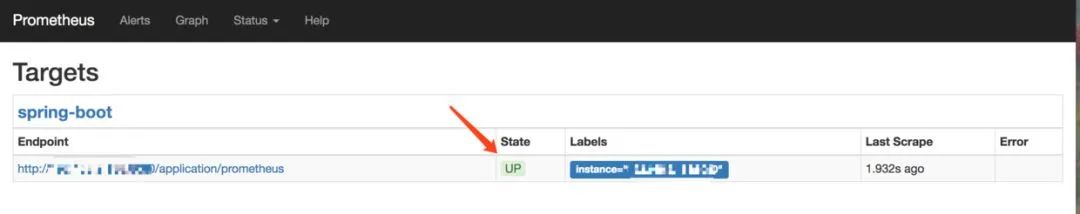
啟動完成后用docker ps看下是否已經(jīng)啟動成功,之后打開瀏覽器輸入:http://localhost:9090/targets,檢查 Spring Boot 采集狀態(tài)是否正常,如果看到下圖就是成功了。
3、Grafana 可視化監(jiān)控數(shù)據(jù)
首先,獲取 Grafana 的 Docker 鏡像:
$ docker pull grafana/grafana1
然后,啟動 Grafana:
$ docker run --name grafana -d -p 3000:3000 grafana/grafana1
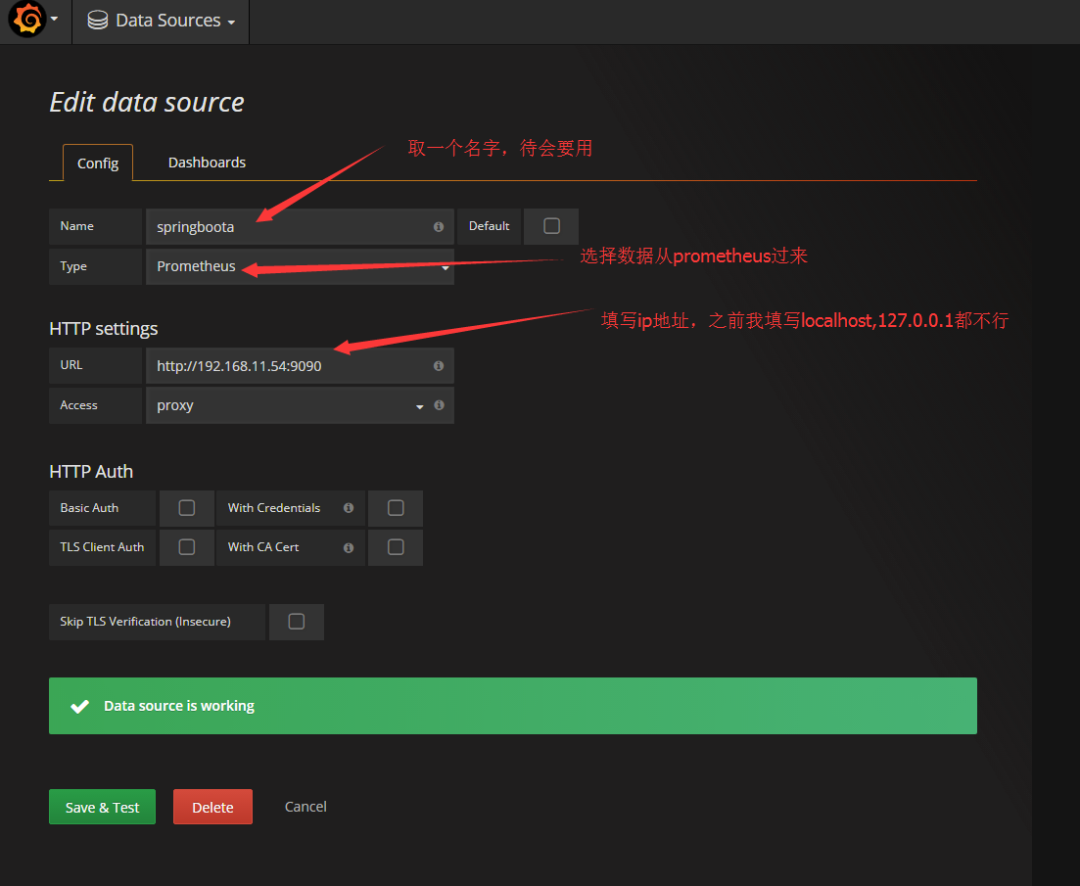
接著,訪問 http://localhost:3000/ 配置 Prometheus 數(shù)據(jù)源:
Grafana 登錄賬號 admin 密碼 admin
先配置數(shù)據(jù)源.
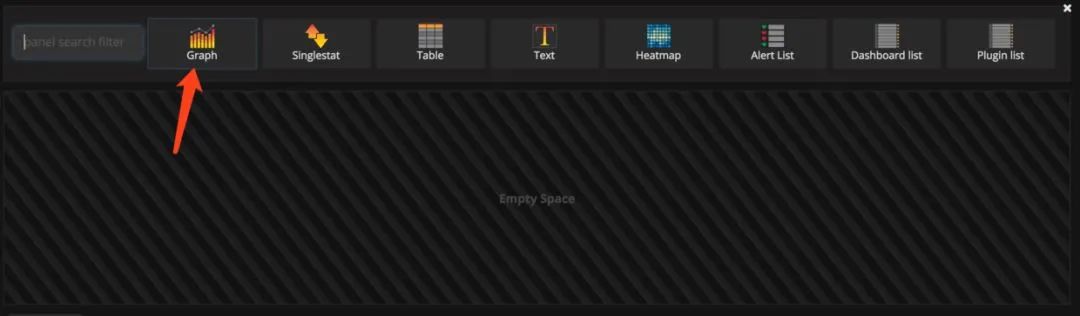
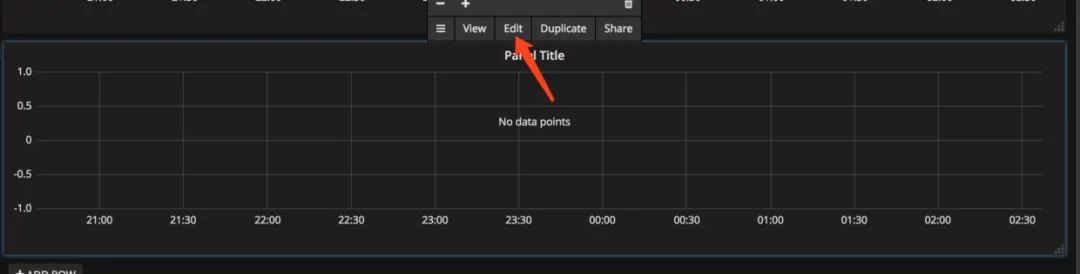
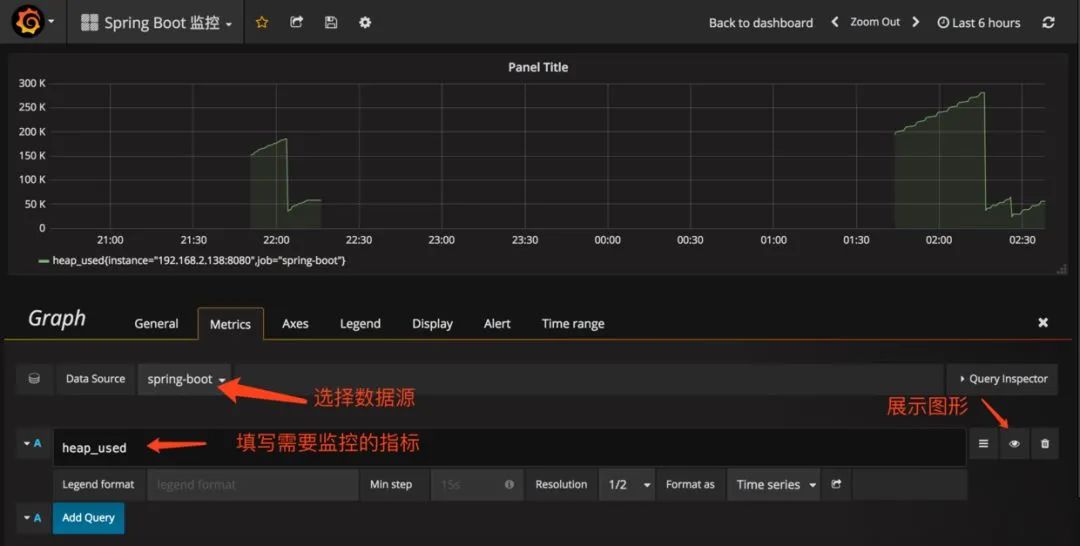
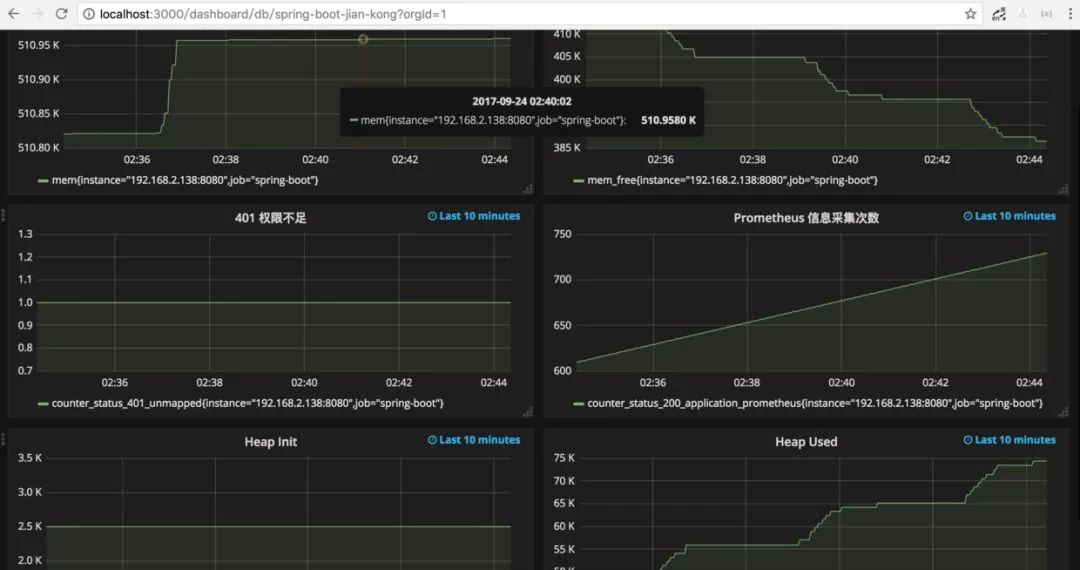
2.配置單個指標(biāo)的可視化監(jiān)控面板:
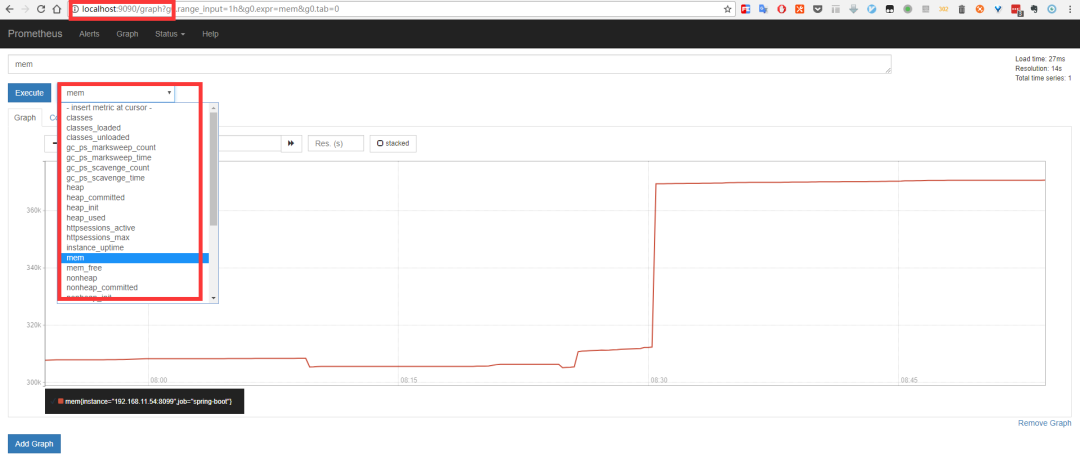
prometh采集的數(shù)據(jù)
如有文章對你有幫助,
“在看”和轉(zhuǎn)發(fā)是對我最大的支持!
推薦, Java面試手冊 內(nèi)容包括網(wǎng)絡(luò)協(xié)議、Java基礎(chǔ)、進(jìn)階、字符串、集合、并發(fā)、JVM、數(shù)據(jù)結(jié)構(gòu)、算法、MySQL、Redis、Mongo、Spring、SpringBoot、MyBatis、SpringCloud、Linux以及各種中間件(Dubbo、Nginx、Zookeeper、MQ、Kafka、ElasticSearch)等等...
點擊文末“閱讀原文”可直達(dá)