
Python生成圖文并茂的PDF報(bào)告
↑ 關(guān)注 + 星標(biāo) ,每天學(xué)Python新技能
后臺(tái)回復(fù)【大禮包】送你Python自學(xué)大禮包
來(lái)源:網(wǎng)絡(luò)
reportlab是Python的一個(gè)標(biāo)準(zhǔn)庫(kù),可以畫圖、畫表格、編輯文字,最后可以輸出PDF格式。它的邏輯和編輯一個(gè)word文檔或者PPT很像。有兩種方法:
1)建立一個(gè)空白文檔,然后在上面寫文字、畫圖等;
2)建立一個(gè)空白list,以填充表格的形式插入各種文本框、圖片等,最后生成PDF文檔。
因?yàn)樾枰a(chǎn)生一份給用戶看的報(bào)告,里面需要插入圖片、表格等,所以采用的是第二種方法。
安裝第三方庫(kù)
reportlab輸入Python的第三方庫(kù),使用前需要先安裝:pip install reportlab
模塊導(dǎo)入
提前導(dǎo)入相關(guān)內(nèi)容,并且注冊(cè)字體。(注冊(cè)字體前需要先準(zhǔn)備好字體文件)
from reportlab.pdfbase import pdfmetrics   # 注冊(cè)字體
from reportlab.pdfbase.ttfonts import TTFont # 字體類
from reportlab.platypus import Table, SimpleDocTemplate, Paragraph, Image  # 報(bào)告內(nèi)容相關(guān)類
from reportlab.lib.pagesizes import letter  # 頁(yè)面的標(biāo)志尺寸(8.5*inch, 11*inch)
from reportlab.lib.styles import getSampleStyleSheet  # 文本樣式
from reportlab.lib import colors  # 顏色模塊
from reportlab.graphics.charts.barcharts import VerticalBarChart  # 圖表類
from reportlab.graphics.charts.legends import Legend  # 圖例類
from reportlab.graphics.shapes import Drawing  # 繪圖工具
from reportlab.lib.units import cm  # 單位:cm

# 注冊(cè)字體(提前準(zhǔn)備好字體文件, 如果同一個(gè)文件需要多種字體可以注冊(cè)多個(gè))
pdfmetrics.registerFont(TTFont('SimSun', 'SimSun.ttf'))
封裝不同內(nèi)容對(duì)應(yīng)的函數(shù)
創(chuàng)建一個(gè)Graphs類,通過(guò)不同的靜態(tài)方法提供不同的報(bào)告內(nèi)容,包括:標(biāo)題、普通段落、圖片、表格和圖表。函數(shù)中的相關(guān)數(shù)據(jù)目前絕大多數(shù)都是固定值,可以根據(jù)情況自行設(shè)置成相關(guān)參數(shù)。
class Graphs:
    # 繪制標(biāo)題
    @staticmethod
    def draw_title(title: str):
        # 獲取所有樣式表
        style = getSampleStyleSheet()
        # 拿到標(biāo)題樣式
        ct = style['Heading1']
        # 單獨(dú)設(shè)置樣式相關(guān)屬性
        ct.fontName = 'SimSun'      # 字體名
        ct.fontSize = 18            # 字體大小
        ct.leading = 50             # 行間距
        ct.textColor = colors.green     # 字體顏色
        ct.alignment = 1    # 居中
        ct.bold = True
        # 創(chuàng)建標(biāo)題對(duì)應(yīng)的段落,并且返回
        return Paragraph(title, ct)

  # 繪制小標(biāo)題
    @staticmethod
    def draw_little_title(title: str):
        # 獲取所有樣式表
        style = getSampleStyleSheet()
        # 拿到標(biāo)題樣式
        ct = style['Normal']
        # 單獨(dú)設(shè)置樣式相關(guān)屬性
        ct.fontName = 'SimSun'  # 字體名
        ct.fontSize = 15  # 字體大小
        ct.leading = 30  # 行間距
        ct.textColor = colors.red  # 字體顏色
        # 創(chuàng)建標(biāo)題對(duì)應(yīng)的段落,并且返回
        return Paragraph(title, ct)

    # 繪制普通段落內(nèi)容
    @staticmethod
    def draw_text(text: str):
        # 獲取所有樣式表
        style = getSampleStyleSheet()
        # 獲取普通樣式
        ct = style['Normal']
        ct.fontName = 'SimSun'
        ct.fontSize = 12
        ct.wordWrap = 'CJK'     # 設(shè)置自動(dòng)換行
        ct.alignment = 0        # 左對(duì)齊
        ct.firstLineIndent = 32     # 第一行開(kāi)頭空格
        ct.leading = 25
        return Paragraph(text, ct)

    # 繪制表格
    @staticmethod
    def draw_table(*args):
        # 列寬度
        col_width = 120
        style = [
            ('FONTNAME', (0, 0), (-1, -1), 'SimSun'),  # 字體
            ('FONTSIZE', (0, 0), (-1, 0), 12),  # 第一行的字體大小
            ('FONTSIZE', (0, 1), (-1, -1), 10),  # 第二行到最后一行的字體大小
            ('BACKGROUND', (0, 0), (-1, 0), '#d5dae6'),  # 設(shè)置第一行背景顏色
            ('ALIGN', (0, 0), (-1, -1), 'CENTER'),  # 第一行水平居中
            ('ALIGN', (0, 1), (-1, -1), 'LEFT'),  # 第二行到最后一行左右左對(duì)齊
            ('VALIGN', (0, 0), (-1, -1), 'MIDDLE'),  # 所有表格上下居中對(duì)齊
            ('TEXTCOLOR', (0, 0), (-1, -1), colors.darkslategray),  # 設(shè)置表格內(nèi)文字顏色
            ('GRID', (0, 0), (-1, -1), 0.5, colors.grey),  # 設(shè)置表格框線為grey色,線寬為0.5
            # ('SPAN', (0, 1), (0, 2)),  # 合并第一列二三行
            # ('SPAN', (0, 3), (0, 4)),  # 合并第一列三四行
            # ('SPAN', (0, 5), (0, 6)),  # 合并第一列五六行
            # ('SPAN', (0, 7), (0, 8)),  # 合并第一列五六行
        ]
        table = Table(args, colWidths=col_width, style=style)
        return table

    # 創(chuàng)建圖表
    @staticmethod
    def draw_bar(bar_data: list, ax: list, items: list):
        drawing = Drawing(500, 250)
        bc = VerticalBarChart()
        bc.x = 45       # 整個(gè)圖表的x坐標(biāo)
        bc.y = 45      # 整個(gè)圖表的y坐標(biāo)
        bc.height = 200     # 圖表的高度
        bc.width = 350      # 圖表的寬度
        bc.data = bar_data
        bc.strokeColor = colors.black       # 頂部和右邊軸線的顏色
        bc.valueAxis.valueMin = 5000           # 設(shè)置y坐標(biāo)的最小值
        bc.valueAxis.valueMax = 26000         # 設(shè)置y坐標(biāo)的最大值
        bc.valueAxis.valueStep = 2000         # 設(shè)置y坐標(biāo)的步長(zhǎng)
        bc.categoryAxis.labels.dx = 2
        bc.categoryAxis.labels.dy = -8
        bc.categoryAxis.labels.angle = 20
        bc.categoryAxis.categoryNames = ax

        # 圖示
        leg = Legend()
        leg.fontName = 'SimSun'
        leg.alignment = 'right'
        leg.boxAnchor = 'ne'
        leg.x = 475         # 圖例的x坐標(biāo)
        leg.y = 240
        leg.dxTextSpace = 10
        leg.columnMaximum = 3
        leg.colorNamePairs = items
        drawing.add(leg)
        drawing.add(bc)
        return drawing

    # 繪制圖片
    @staticmethod
    def draw_img(path):
        img = Image(path)       # 讀取指定路徑下的圖片
        img.drawWidth = 5*cm        # 設(shè)置圖片的寬度
        img.drawHeight = 8*cm       # 設(shè)置圖片的高度
        return img
生成報(bào)告
if __name__ == '__main__':
# 創(chuàng)建內(nèi)容對(duì)應(yīng)的空列表
content = list()
# 添加標(biāo)題
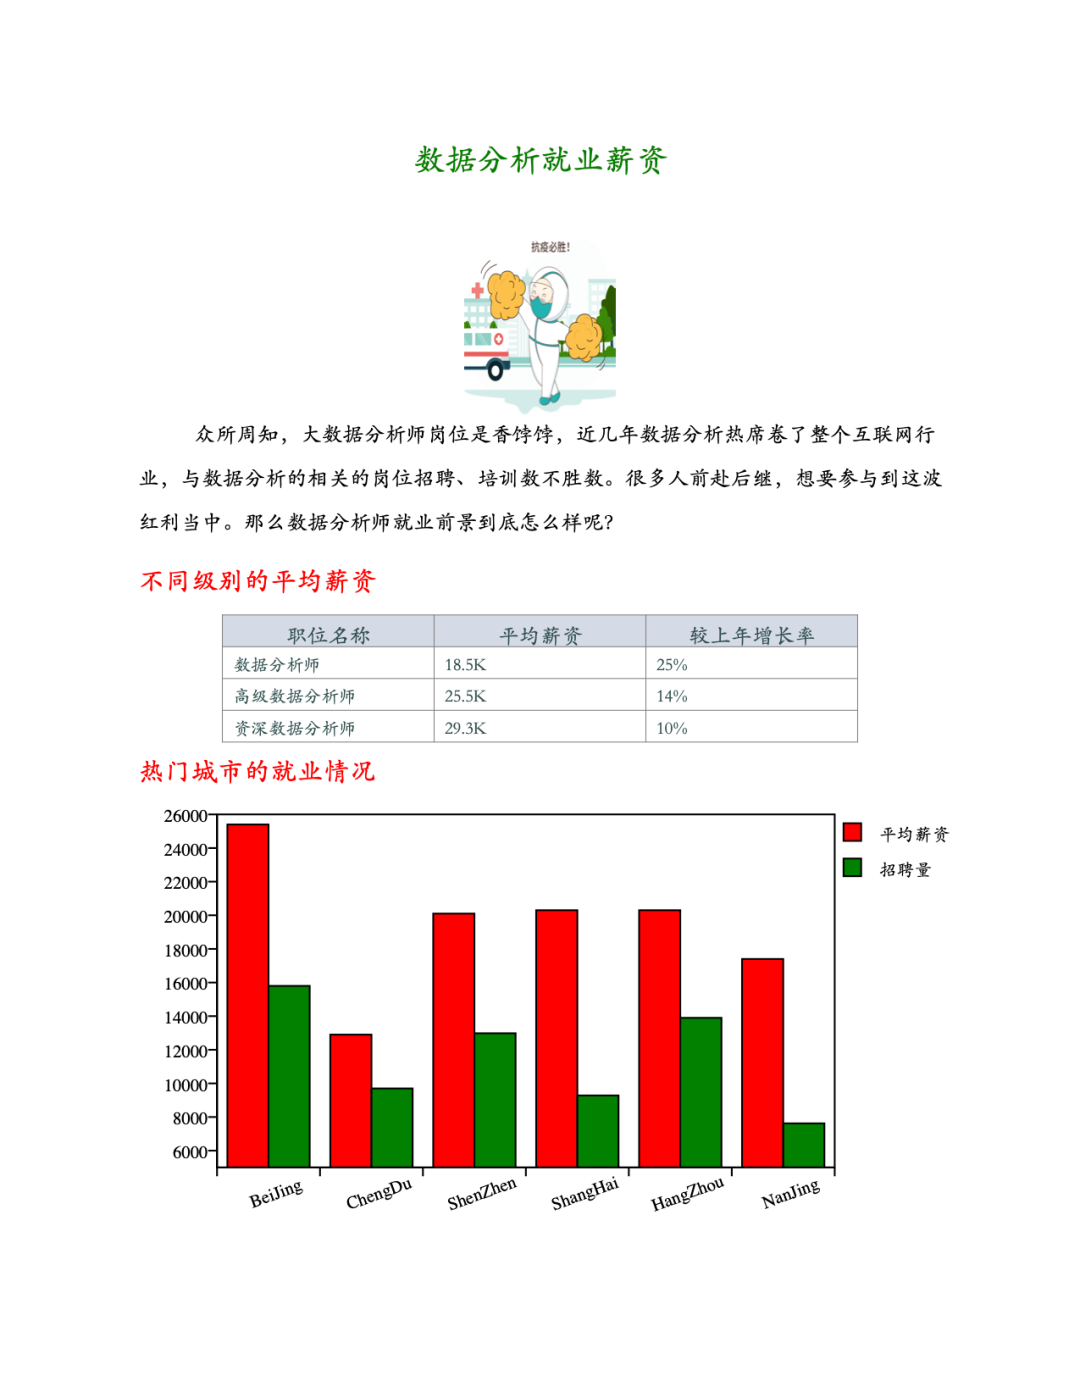
content.append(Graphs.draw_title('數(shù)據(jù)分析就業(yè)薪資'))
# 添加圖片
content.append(Graphs.draw_img('抗疫必勝.png'))
# 添加段落文字
content.append(Graphs.draw_text('眾所周知,大數(shù)據(jù)分析師崗位是香餑餑,近幾年數(shù)據(jù)分析熱席卷了整個(gè)互聯(lián)網(wǎng)行業(yè),與數(shù)據(jù)分析的相關(guān)的崗位招聘、培訓(xùn)數(shù)不勝數(shù)。很多人前赴后繼,想要參與到這波紅利當(dāng)中。那么數(shù)據(jù)分析師就業(yè)前景到底怎么樣呢?'))
# 添加小標(biāo)題
content.append(Graphs.draw_title(''))
content.append(Graphs.draw_little_title('不同級(jí)別的平均薪資'))
# 添加表格
data = [
('職位名稱', '平均薪資', '較上年增長(zhǎng)率'),
('數(shù)據(jù)分析師', '18.5K', '25%'),
('高級(jí)數(shù)據(jù)分析師', '25.5K', '14%'),
('資深數(shù)據(jù)分析師', '29.3K', '10%')
]
content.append(Graphs.draw_table(*data))
# 生成圖表
content.append(Graphs.draw_title(''))
content.append(Graphs.draw_little_title('熱門城市的就業(yè)情況'))
b_data = [(25400, 12900, 20100, 20300, 20300, 17400), (15800, 9700, 12982, 9283, 13900, 7623)]
ax_data = ['BeiJing', 'ChengDu', 'ShenZhen', 'ShangHai', 'HangZhou', 'NanJing']
leg_items = [(colors.red, '平均薪資'), (colors.green, '招聘量')]
content.append(Graphs.draw_bar(b_data, ax_data, leg_items))
# 生成pdf文件
doc = SimpleDocTemplate('report.pdf', pagesize=letter)
doc.build(content)
生成報(bào)告的結(jié)果如下:


評(píng)論
圖片
表情