
北京空氣質(zhì)量真的很差嗎?Python繪制熱力圖一目了然
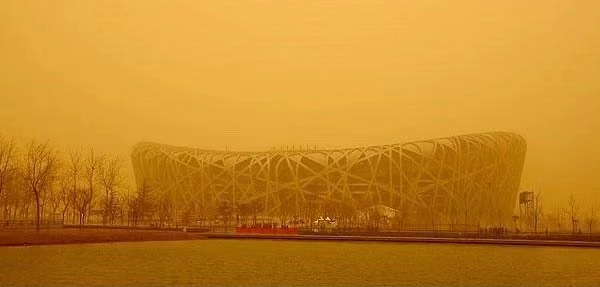
今年3月,北京時(shí)隔6年再次遭遇沙塵暴,大家一起被迫吃土!上次沙塵暴出現(xiàn)還是在2015年4月15日。
記得那天早上起床,打開手機(jī)看到好多盆友發(fā)來的詢問關(guān)懷“聽說北京沙塵暴了,注意安全哦”,比心 ! 隨后拉開窗簾,果然是漫天黃沙還伴隨著大風(fēng),打開朋友圈滿屏的銀翼殺手、末日的關(guān)鍵字。
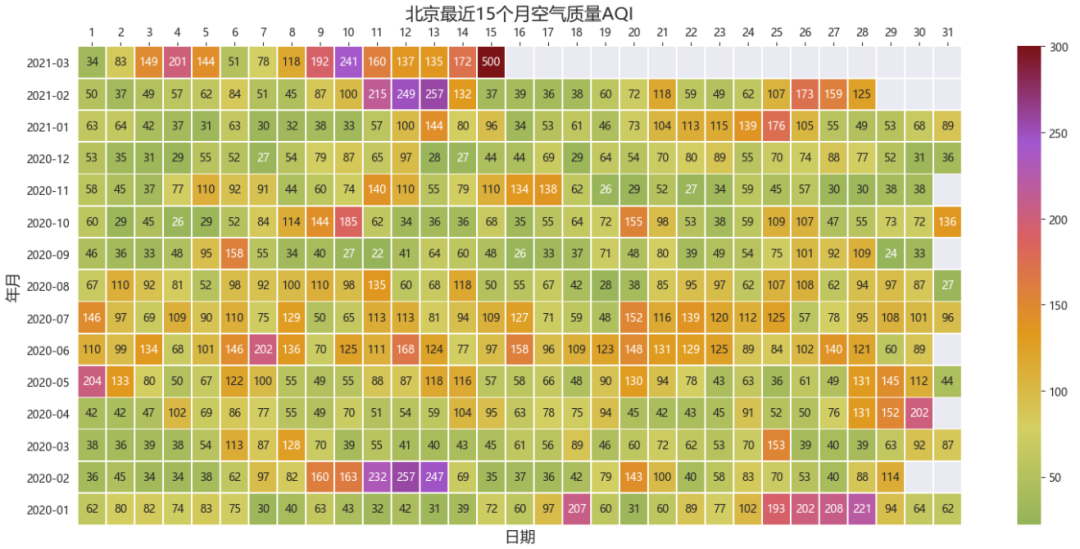
其實(shí),我們看看北京最近15個(gè)月空氣質(zhì)量熱力圖發(fā)現(xiàn),大部分的時(shí)間空氣質(zhì)量還是不錯(cuò)的,良好與優(yōu)秀居多。
注意:綠色(50以下) 表示優(yōu)秀,黃色(50-100)表示良好,橙色及其他屬于污染。
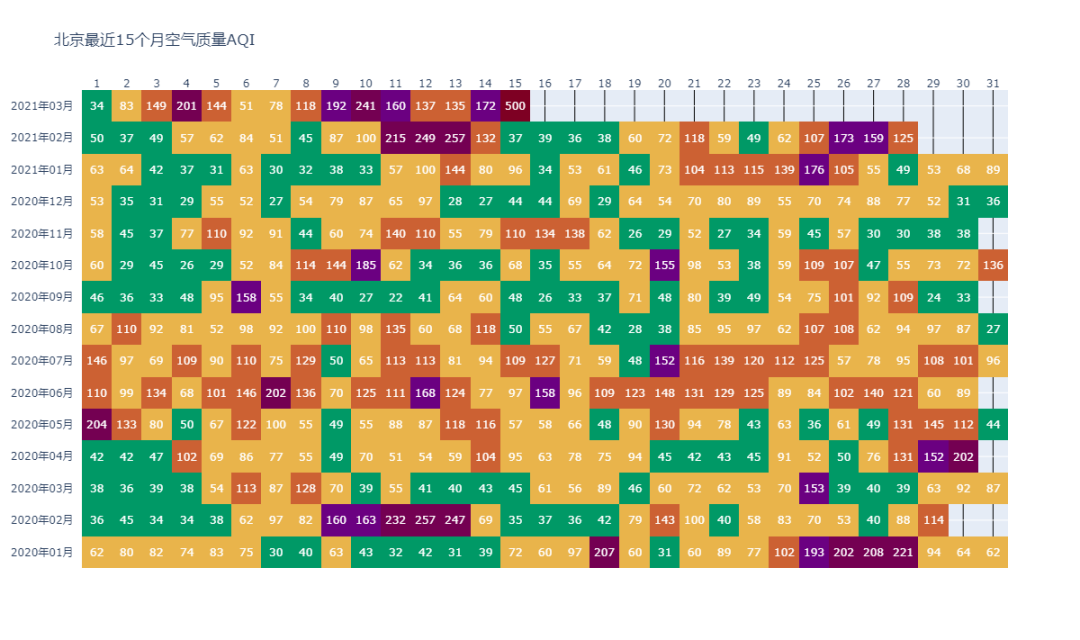
上面這張熱力圖是用Python繪制的,今天就來講一講是如何做出來的。
目錄:
0. 圖賞
1. 空氣質(zhì)量數(shù)據(jù)獲取
2. 數(shù)據(jù)預(yù)處理
3. 熱力圖繪制
3.1. seaborn的heatmap熱力圖
3.2. plotly的熱力圖繪制
4. 附
0. 圖賞
鳥巢:
故宮角樓:

大褲衩:

銀翼殺手:

我上班路上:
2021年03月15日早上10點(diǎn)上班路上
1. 空氣質(zhì)量數(shù)據(jù)獲取
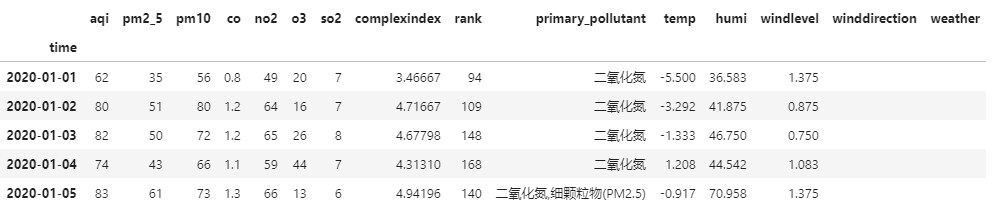
這里我們從akshare庫的接口直接獲取北京市歷史空氣質(zhì)量數(shù)據(jù)
import akshare as ak

air_quality_hist_df = ak.air_quality_hist(city="北京", period="day", start_date="2020-01-01", end_date="2021-03-15")
air_quality_hist_df.head()
2. 數(shù)據(jù)預(yù)處理
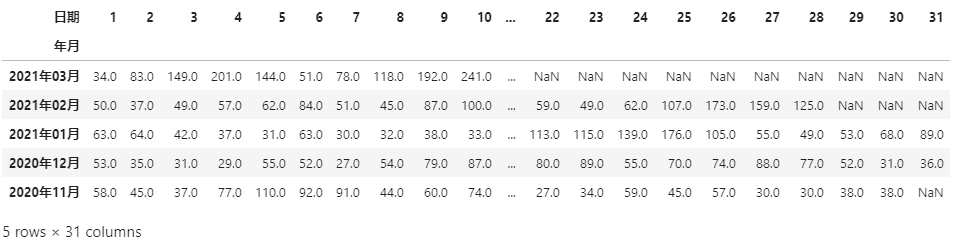
由于繪制熱力圖x軸是日期(1-31),y軸是年月。因此我們需要對(duì)原數(shù)據(jù)進(jìn)行寬表轉(zhuǎn)化和一些簡單的預(yù)處理。
注意:處理過程詳情代碼注釋說明。
import pandas as pd

# 拷貝并進(jìn)行索引重置
df = air_quality_hist_df[['aqi']].copy()
df.reset_index(inplace=True)
# 將time字段改為時(shí)間格式
df.time = pd.to_datetime(df.time)
# 新增年月字段,內(nèi)容為 x年x月,如2021年3月,為字符串格式
df['年月'] = df.time.apply(lambda x:x.strftime('%Y{y}%m{m}').format(y="年",m="月"))
# 新增日期字段,內(nèi)容為 1-31
df['日期'] = df['time'].dt.day

# 做透視處理,將長表轉(zhuǎn)化為寬表
data = pd.pivot(df,
                values='aqi',
                index='年月',
                columns='日期')
# 轉(zhuǎn)化后部分月份不存在部分日期默認(rèn)為nan值,需要轉(zhuǎn)化為數(shù)字格式 float(無法轉(zhuǎn)化為int)
data = data.astype('float')
# 按照 索引年月倒序排序
data.sort_index(ascending=False,inplace=True)

data.head()
3. 熱力圖繪制
這里我們介紹兩種熱力圖繪制手法,其一是sns.heatmap(),其二是plotly的ff.create_annotated_heatmap()。
3.1. seaborn的heatmap熱力圖
import matplotlib.pyplot as plt
import matplotlib.colors as mcolors
import seaborn as sns

#設(shè)置全局默認(rèn)字體 為 雅黑
plt.rcParams['font.family'] = ['Microsoft YaHei']
# 設(shè)置全局軸標(biāo)簽字典大小
plt.rcParams["axes.labelsize"] = 14
# 設(shè)置背景
sns.set_style("darkgrid",{"font.family":['Microsoft YaHei', 'SimHei']})
# 設(shè)置畫布長寬 和 dpi
plt.figure(figsize=(18,8),dpi=100)
# 自定義色卡
cmap = mcolors.LinearSegmentedColormap.from_list("n",['#95B359','#D3CF63','#E0991D','#D96161','#A257D0','#7B1216'])
# 繪制熱力圖
ax = sns.heatmap( data, cmap=cmap, vmax=300,
                 annot=True, # 熱力圖上顯示數(shù)值
                 fmt='0.f', # 數(shù)值格式
                 linewidths=0.5,)
ax.set_title( label='北京最近15個(gè)月空氣質(zhì)量AQI',fontdict = {'fontsize': 16})
# 將x軸刻度放在最上面
ax.xaxis.set_ticks_position('top')
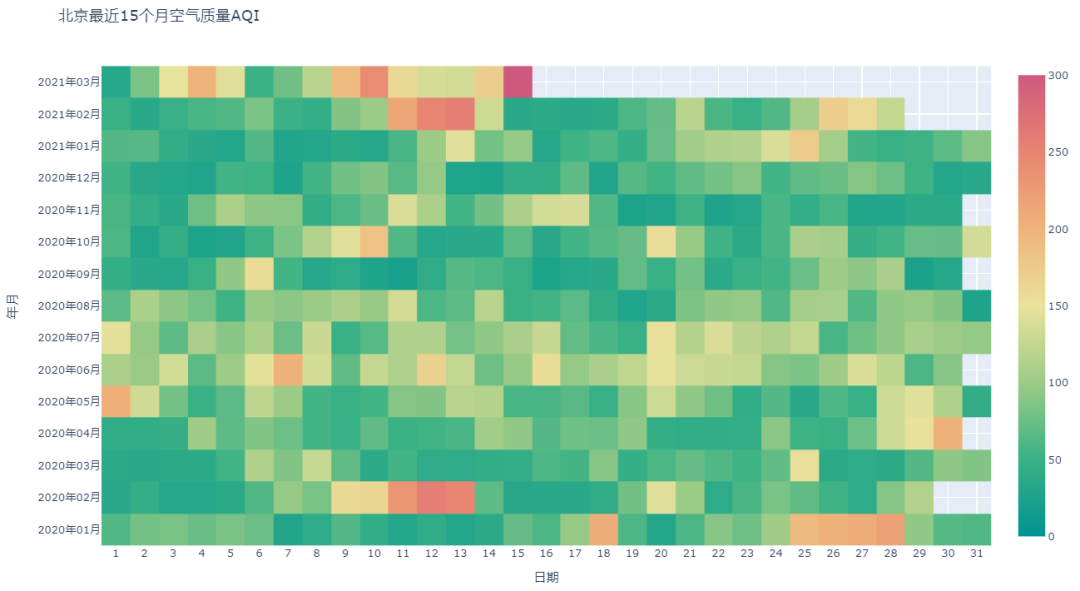
3.2. plotly的熱力圖繪制
對(duì)于plotly來說,plotly.express可以直接將滿足條件格式的dataframe數(shù)據(jù)用px.imshow()繪制,不過試了很久暫時(shí)沒學(xué)會(huì)怎么方便的將數(shù)值顯示在熱力圖上。找了半天發(fā)現(xiàn)plotly提供另外一種方式create_annotated_heatmap,專門用來顯示數(shù)值。
px.imshow方法:
import plotly.express as px
# import plotly.graph_objs as go

fig = px.imshow(data,
               color_continuous_scale='Temps',
               color_continuous_midpoint= 75 ,
               range_color = [0,300],
               title = '北京最近15個(gè)月空氣質(zhì)量AQI',
               width=1200,
               height=711,
               )
fig.update_layout(xaxis=dict(tickmode='linear'), # x軸全部顯示
                 )
fig.show()
create_annotated_heatmap方法:
以下重點(diǎn)介紹該方法
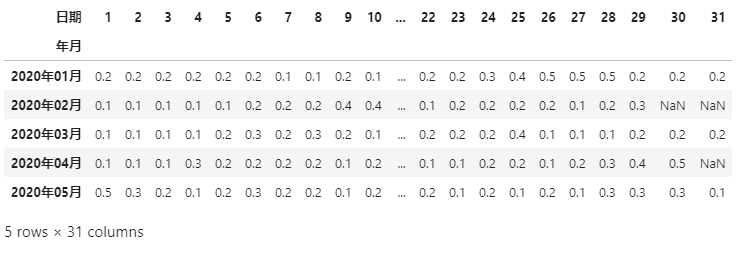
由于繪圖的時(shí)候 順序和之前是反的,所以需要先進(jìn)行順序逆序調(diào)整; 為了更好的根據(jù)aqi數(shù)值進(jìn)行顏色分配,我們可以對(duì)數(shù)據(jù)進(jìn)行分箱操作; 為了讓顏色和空氣質(zhì)量指數(shù)級(jí)別色卡一致,我們可以自定義顏色色卡; 為了更好的在熱力圖上顯示數(shù)值,需要將原來的float轉(zhuǎn)化為int,nan轉(zhuǎn)化為空字符。
# 數(shù)據(jù)分箱操作
data.sort_index(ascending=True,inplace=True)
bins = [0,50,100,150,200,300,999]
groups = [.1,.2,.3,.4,.5,.6]
data1 = data.apply(lambda x: pd.cut(x,bins,labels=groups))
data1.head()
import plotly.figure_factory as ff
import numpy as np

x = list(data.columns)
y = list(data.index)
z = data1.values.tolist()
z_text = data3.fillna('').values.tolist() # data3 為初始未進(jìn)行格式轉(zhuǎn)化的透視寬表
# 自定義色卡
colorscale=[[0.0, 'rgb(0,153,102)'], [.1, 'rgb(211, 207, 99)'],
            [.3, 'rgb(255, 153, 51)'], [.4, 'rgb(204, 97, 51)'],
            [.5, 'rgb(102, 0, 153)'],[1.0, 'rgb(126, 0, 35)']]

fig = ff.create_annotated_heatmap(z, x=x, y=y,
                                  annotation_text=z_text,
                                  colorscale=colorscale,
                                 )
fig.update_layout(title ='北京最近15個(gè)月空氣質(zhì)量AQI',
                   width=1200,
                   height=711,
                 )
# 將x軸刻度放在最上面
fig.update_xaxes(side="top")
fig.show()
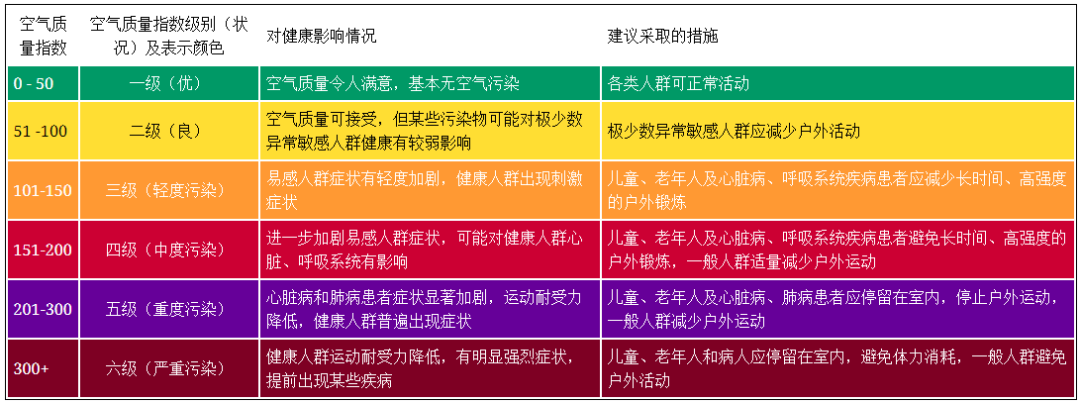
4. 附
空氣質(zhì)量指數(shù)色卡對(duì)照表:
matplotlib 熱力圖繪制參考:
https://matplotlib.org/stable/gallery/images_contours_and_fields/image_annotated_heatmap.html
plotly元素周期表繪制案例:
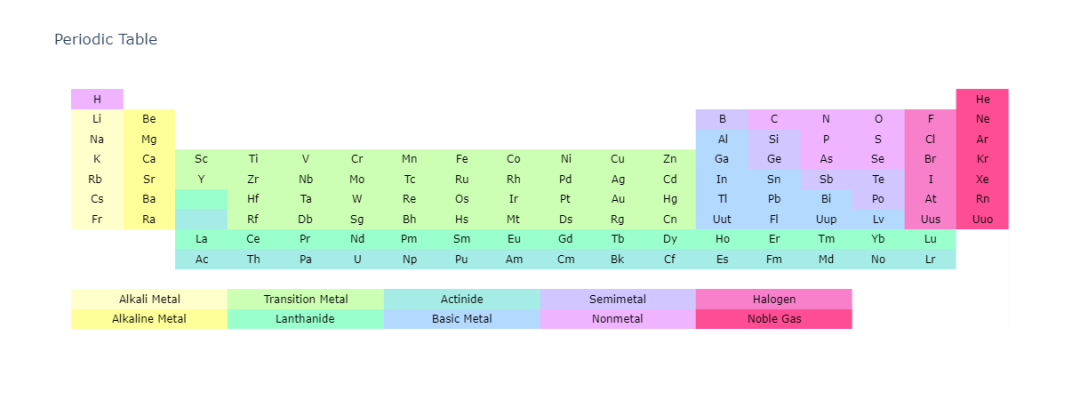
# Add Periodic Table Data
symbol = [['H', '', '', '', '', '', '', '', '', '', '', '', '', '', '', '', '', 'He'],
         ['Li', 'Be', '', '', '', '', '', '', '', '', '', '', 'B', 'C', 'N', 'O', 'F', 'Ne'],
         ['Na', 'Mg', '', '', '', '', '', '', '', '', '', '', 'Al', 'Si', 'P', 'S', 'Cl', 'Ar'],
         ['K', 'Ca', 'Sc', 'Ti', 'V', 'Cr', 'Mn', 'Fe', 'Co', 'Ni', 'Cu', 'Zn', 'Ga', 'Ge', 'As', 'Se', 'Br', 'Kr'],
         ['Rb ', 'Sr', 'Y', 'Zr', 'Nb', 'Mo', 'Tc', 'Ru', 'Rh', 'Pd', 'Ag', 'Cd', 'In', 'Sn', 'Sb', 'Te', 'I', 'Xe' ],
         ['Cs', 'Ba', '', 'Hf', 'Ta', 'W', 'Re', 'Os', 'Ir', 'Pt', 'Au', 'Hg', 'Tl', 'Pb', 'Bi', 'Po', 'At', 'Rn' ],
         ['Fr', 'Ra', '', 'Rf', 'Db', 'Sg', 'Bh', 'Hs', 'Mt', 'Ds', 'Rg', 'Cn', 'Uut', 'Fl', 'Uup', 'Lv', 'Uus', 'Uuo'],
         ['', '', 'La', 'Ce', 'Pr', 'Nd', 'Pm', 'Sm', 'Eu', 'Gd', 'Tb', 'Dy', 'Ho', 'Er', 'Tm', 'Yb', 'Lu', ''],
         ['', '', 'Ac', 'Th', 'Pa', 'U', 'Np', 'Pu', 'Am', 'Cm', 'Bk', 'Cf', 'Es', 'Fm', 'Md', 'No', 'Lr', '' ],
         ['', '', '', '', '', '', '', '', '', '', '', '', '', '', '', '', '', ''],
         ['', 'Alkali Metal', '', '', 'Transition Metal', '', '', 'Actinide', '', '', 'Semimetal', '', '', 'Halogen', '', '', '', ''],
         ['', 'Alkaline Metal', '', '', 'Lanthanide', '', '', 'Basic Metal', '', '', 'Nonmetal', '', '', 'Noble Gas', '', '', '', '']]

element = [['Hydrogen', '', '', '', '', '', '', '', '', '', '', '', '', '', '', '', '', 'Helium'],
           ['Lithium', 'Beryllium', '', '', '', '', '', '', '', '', '', '', 'Boron', 'Carbon', 'Nitrogen', 'Oxygen', 'Fluorine', 'Neon'],
           ['Sodium', 'Magnesium', '', '', '', '', '', '', '', '', '', '', 'Aluminium', 'Silicon', 'Phosphorus', 'Sulfur', 'Chlorine', ' Argon'],
           ['Potassium', ' Calcium', ' Scandium', ' Titanium', ' Vanadium', ' Chromium',  'Manganese', 'Iron', 'Cobalt', 'Nickel', 'Copper', 'Zinc', 'Gallium', 'Germanium', 'Arsenic', 'Selenium', 'Bromine', 'Krypton'],
           ['Rubidium', 'Strontium', 'Yttrium', 'Zirconium', 'Niobium', 'Molybdenum', 'Technetium', 'Ruthenium', 'Rhodium', 'Palladium', 'Silver', 'Cadmium', 'Indium', 'Tin', 'Antimony', 'Tellurium', 'Iodine', 'Xenon'],
           [' Cesium', ' Barium', '',  'Hafnium', 'Tantalum', 'Tungsten', 'Rhenium', 'Osmium', 'Iridium', 'Platinum', 'Gold', 'Mercury', 'Thallium', 'Lead', 'Bismuth', 'Polonium', 'Astatine', 'Radon'],
           [' Francium', ' Radium', '', 'Rutherfordium','Dubnium','Seaborgium','Bohrium','Hassium','Meitnerium','Darmstadtium','Roentgenium','Copernicium','Ununtrium','Ununquadium','Ununpentium','Ununhexium','Ununseptium','Ununoctium'],
           ['', '',  'Lanthanum', 'Cerium', 'Praseodymium', 'Neodymium', 'Promethium', 'Samarium', 'Europium', 'Gadolinium', 'Terbium', 'Dysprosium', 'Holmium', 'Erbium', 'Thulium', 'Ytterbium', 'Lutetium', ''],
           ['', '', 'Actinium', 'Thorium', 'Protactinium', 'Uranium', 'Neptunium', 'Plutonium', 'Americium', 'Curium', 'Berkelium', 'Californium', 'Einsteinium','Fermium' ,'Mendelevium', 'Nobelium', 'Lawrencium', '' ],
           ['', '', '', '', '', '', '', '', '', '', '', '', '', '', '', '', '', ''],
           ['', '', '', '', '', '', '', '', '', '', '', '', '', '', '', '', '', ''],
           ['', '', '', '', '', '', '', '', '', '', '', '', '', '', '', '', '', '']]

atomic_mass = [[ 1.00794, .0, .0, .0, .0, .0, .0, .0, .0, .0, .0, .0, .0, .0, .0, .0, .0,  4.002602],
     [ 6.941, 9.012182, .0, .0, .0, .0, .0, .0, .0, .0, .0, .0,  10.811, 12.0107, 14.0067, 15.9994, 18.9984032, 20.1797],
     [ 22.98976928, 24.3050, .0, .0, .0, .0, .0, .0, .0, .0, .0, .0,  26.9815386, 28.0855, 30.973762, 32.065, 35.453, 39.948],
     [ 39.0983, 40.078, 44.955912, 47.867, 50.9415, 51.9961, 54.938045, 55.845, 58.933195, 58.6934, 63.546, 65.38, 69.723, 72.64, 74.92160, 78.96, 79.904, 83.798],
     [ 85.4678, 87.62, 88.90585, 91.224, 92.90638, 95.96, 98, 101.07, 102.90550, 106.42, 107.8682, 112.411, 114.818, 118.710, 121.760, 127.60, 126.90447, 131.293],
     [ 132.9054519, 137.327, .0, 178.49, 180.94788, 183.84, 186.207, 190.23, 192.217, 195.084, 196.966569, 200.59, 204.3833, 207.2, 208.98040, 209, 210, 222],
     [223, 226, .0, 267, 268, 271, 272, 270, 276, 281, 280, 285, 284, 289, 288, 293, 'unknown', 294],
     [.0, .0, 138.90547, 140.116, 140.90765, 144.242, 145, 150.36, 151.964, 157.25, 158.92535, 162.500, 164.93032, 167.259, 168.93421, 173.054, 174.9668, .0],
     [.0, .0, 227, 232.03806, 231.03588, 238.02891, 237, 244, 243, 247, 247, 251, 252, 257, 258, 259, 262, .0],
     [.0, .0, .0, .0, .0, .0, .0, .0, .0, .0, .0, .0, .0, .0, .0, .0, .0, .0],
     [.0, .0, .0, .0, .0, .0, .0, .0, .0, .0, .0, .0, .0, .0, .0, .0, .0, .0],
     [.0, .0, .0, .0, .0, .0, .0, .0, .0, .0, .0, .0, .0, .0, .0, .0, .0, .0]]

z = [[.8, .0, .0, .0, .0, .0, .0, .0, .0, .0, .0, .0, .0, .0, .0, .0, .0, 1.],
     [.1, .2, .0, .0, .0, .0, .0, .0, .0, .0, .0, .0, .7, .8, .8, .8, .9, 1.],
     [.1, .2, .0, .0, .0, .0, .0, .0, .0, .0, .0, .0, .6, .7, .8, .8, .9, 1],
     [.1, .2, .3, .3, .3, .3, .3, .3, .3, .3, .3, .3, .6, .7, .8, .8, .9, 1.],
     [.1, .2, .3, .3, .3, .3, .3, .3, .3, .3, .3, .3, .6, .6, .7, .7, .9, 1.],
     [.1, .2, .4, .3, .3, .3, .3, .3, .3, .3, .3, .3, .6, .6, .6, .7, .9, 1.],
     [.1, .2, .5, .3, .3, .3, .3, .3, .3, .3, .3, .3, .6, .6, .6, .6, .9, 1.],
     [.0, .0, .4, .4, .4, .4, .4, .4, .4, .4, .4, .4, .4, .4, .4, .4, .4, .0],
     [.0, .0, .5, .5, .5, .5, .5, .5, .5, .5, .5, .5, .5, .5, .5, .5, .5, .0],
     [.0, .0, .0, .0, .0, .0, .0, .0, .0, .0, .0, .0, .0, .0, .0, .0, .0, .0],
     [.1, .1, .1, .3, .3, .3, .5, .5, .5, .7, .7, .7, .9, .9, .9, .0, .0, .0],
     [.2, .2, .2, .4, .4, .4, .6, .6, .6, .8, .8, .8, 1., 1., 1., .0, .0, .0]]

# Display element name and atomic mass on hover
hover=[]
for x in range(len(symbol)):
    hover.append([i + '<br>' + 'Atomic Mass: ' + str(j)
                      for i, j in zip(element[x], atomic_mass[x])])

# Invert Matrices
symbol = symbol[::-1]
hover = hover[::-1]
z = z[::-1]

# Set Colorscale
colorscale=[[0.0, 'rgb(255,255,255)'], [.2, 'rgb(255, 255, 153)'],
            [.4, 'rgb(153, 255, 204)'], [.6, 'rgb(179, 217, 255)'],
            [.8, 'rgb(240, 179, 255)'],[1.0, 'rgb(255, 77, 148)']]

# Make Annotated Heatmap
fig = ff.create_annotated_heatmap(z, annotation_text=symbol, text=hover,
                                 colorscale=colorscale, font_colors=['black'], hoverinfo='text')
fig.update_layout(title_text='Periodic Table')
fig.show()作者:可以叫我才哥
_往期文章推薦_