Python數(shù)據(jù)可視化教程之實(shí)踐篇
本篇文章在基礎(chǔ)篇的基礎(chǔ)上,選擇實(shí)際案例進(jìn)行了練習(xí)。
再明確一次三個步驟:
確定問題,選擇圖形
轉(zhuǎn)換數(shù)據(jù),應(yīng)用函數(shù)
參數(shù)設(shè)置,一目了然
下面,我們通過案例來進(jìn)行演示:
%matplotlib inline
import?numpy as?np
import?pandas as?pd
import?matplotlib.pyplot as?plt #導(dǎo)入plt
import?seaborn as?sns

import?warnings
warnings.filterwarnings('ignore')#忽略警告
?加載數(shù)據(jù)?
數(shù)據(jù)采用kaggle中的共享單車項目,比賽提供了跨越兩年的每小時共享單車租賃數(shù)據(jù),包含天氣信息和日期信息。
?字段說明?
datetime(日期) - hourly date + timestamp
season(季節(jié)) - 1 = spring, 2 = summer, 3 = fall, 4 = winter
holiday(是否假日) - whether the day is considered a holiday
workingday(是否工作日) - whether the day is neither a weekend nor holiday
weather(天氣等級)
Clear, Few clouds, Partly cloudy 清澈,少云,多云。
Mist + Cloudy, Mist + Broken clouds, Mist + Few clouds, Mist 霧+陰天,霧+碎云、霧+少云、霧
Light Snow, Light Rain + Thunderstorm + Scattered clouds, Light Rain + Scattered clouds 小雪、小雨+雷暴+散云,小雨+云
Heavy Rain + Ice Pallets + Thunderstorm + Mist, Snow + Fog 暴雨+冰雹+雷暴+霧,雪+霧
temp(溫度) - temperature in Celsius
atemp(體感溫度) - "feels like" temperature in Celsius
humidity(相對濕度) - relative humidity
windspeed(風(fēng)速) - wind speed
casual(臨時租賃數(shù)量) - number of non-registered user rentals initiated
registered(會員租賃數(shù)量) - number of registered user rentals initiated
count(總租賃數(shù)量) - number of total rentals
date(日期) - 由datetime拆分得到
hour(小時)-由datetime拆分得到
year(年份)-由datetime拆分得到
month(月份)-由datetime拆分得到
weeekday(周幾)-由datetime拆分得到
windspeed_rfr(經(jīng)過隨機(jī)森林樹填充0值得到的風(fēng)速)
#讀取數(shù)據(jù)
#Bikedata = pd.read_csv('./Bike.csv')
Bikedata.head()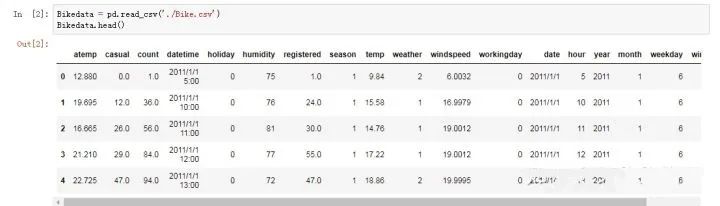
#查看描述統(tǒng)計
Bikedata.describe()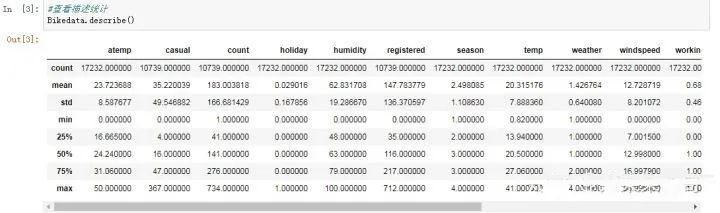
#對于整體數(shù)據(jù),我們希望查看與三個租賃數(shù)量相關(guān)的其他特征值的關(guān)系,可以選用seaborn包的pairplot函數(shù)(多變量圖)
sns.pairplot(Bikedata,x_vars=['holiday','workingday','season','weather','hour','windspeed_rfr','atemp','humidity','temp'],y_vars=['count','registered','casual'],plot_kws={'alpha': 0.1})
0xadcef98> 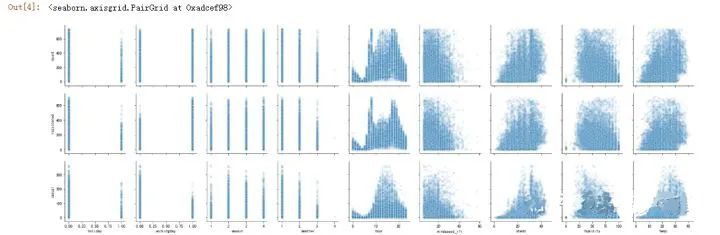
大致可以看出:會員在工作日出行較多,節(jié)假日次數(shù)減少,而臨時用戶相反,第一季度出行人數(shù)總體偏低,出行人數(shù)受天氣影響較大,會員在每天早晚有兩個高峰期,對應(yīng)上下班時間;非會員在下午出行較密集 風(fēng)速對出行人數(shù)有較大的影響 相對濕度,溫度和體感溫度對非會員出行影響較大,對會員出行影響較小。
#接下來,我們通過相關(guān)系數(shù)的大小來依次對特征進(jìn)行可視化分析
#首先,列出相關(guān)系數(shù)矩陣:df.corr()
corrdf = Bikedata.corr()
corrdf
#各特征按照與租賃總量count的相關(guān)系數(shù)大小進(jìn)行排序
corrdf['count'].sort_values(ascending=False)
count????????????1.000000
registered 0.966209
casual 0.704764
hour 0.405437
temp 0.385954
atemp 0.381967
year 0.234959
month 0.164673
season 0.159801
windspeed_rfr 0.111783
windspeed 0.106074
weekday 0.022602
holiday 0.002978
workingday -0.020764
weather -0.127519
humidity -0.317028
Name: count, dtype: float64
可見,特征對租賃總量的影響力為:
時段>溫度>濕度>年份>月份>季節(jié)>天氣>風(fēng)速>工作日>節(jié)假日
?對特征逐項分析?
1
首先對時段進(jìn)行分析
第一步
提出問題:租賃總量對應(yīng)濕度的變化趨勢
適合圖形:因?yàn)闈穸葘儆谶B續(xù)性數(shù)值變量,我們可以選擇折線圖反應(yīng)變化趨勢
第二步
轉(zhuǎn)換數(shù)據(jù):我們需要一個二維數(shù)據(jù)框,按照溫度變化排序,取對應(yīng)的三個租賃數(shù)的平均值
應(yīng)用函數(shù):直接應(yīng)用plt的plot函數(shù)即可完成折線圖
workingday_df = Bikedata[Bikedata['workingday']==1]#t
workingday_df = workingday_df.groupby(['hour'],as_index=True).agg({'count':'mean','registered':'mean','casual':'mean'})

nworkingday_df = Bikedata[Bikedata['workingday']==0]
nworkingday_df = nworkingday_df.groupby(['hour'],as_index=True).agg({'count':'mean','registered':'mean','casual':'mean'})
nworkingday_df.head()
第三步:設(shè)置參數(shù)
figure,axes = plt.subplots(1,2,sharey=True)#設(shè)置一個1*2的畫布,且共享y軸

workingday_df.plot(figsize=(15,5),title='The average number of rentals initiated per hour in the working day',ax=axes[0])
nworkingday_df.plot(figsize=(15,5),title='The average number of rentals initiated per hour in the nworking day',ax=axes[1])
0xe452940>
可以看出:
在工作日,會員出行對應(yīng)兩個很明顯的早晚高峰期,并且在中午會有一個小的高峰,可能對應(yīng)中午外出就餐需求;?
工作日非會員用戶出行高峰大概在下午三點(diǎn);
工作日會員出行次數(shù)遠(yuǎn)多于非會員用戶;
在周末,總體出行趨勢一致,大部分用車發(fā)生在11-5點(diǎn)這段時間,早上五點(diǎn)為用車之最。
2
對溫度進(jìn)行分析
第一步
提出問題:租賃總量對應(yīng)濕度的變化趨勢
適合圖形:因?yàn)闈穸葘儆谶B續(xù)性數(shù)值變量,我們可以選擇折線圖反應(yīng)變化趨勢
第二步
轉(zhuǎn)換數(shù)據(jù):我們需要一個二維數(shù)據(jù)框,按照溫度變化排序,取對應(yīng)的三個租賃數(shù)的平均值
應(yīng)用函數(shù):直接應(yīng)用plt的plot函數(shù)即可完成折線圖
第三步
參數(shù)設(shè)置:只需要設(shè)置折線圖的標(biāo)題,其他參數(shù)默認(rèn)
temp_df = Bikedata.groupby(['temp'],as_index='True').agg({'count':'mean','registered':'mean','casual':'mean'})
temp_df.plot(title = 'The average number of rentals initiated per hour changes with the temperature')
0xe57d7f0> 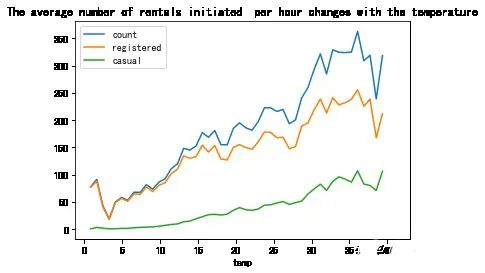
隨著溫度的升高,租賃數(shù)量呈上升趨勢;
在溫度達(dá)到35度時,因天氣炎熱,總體數(shù)量開始下降;
在溫度在4度時,租賃數(shù)達(dá)到最低點(diǎn);
3
濕度對租賃數(shù)量的影響
第一步
提出問題:租賃總量對應(yīng)濕度的變化趨勢
適合圖形:因?yàn)闈穸葘儆谶B續(xù)性數(shù)值變量,我們可以選擇折線圖反應(yīng)變化趨勢
第二步
轉(zhuǎn)換數(shù)據(jù):我們需要一個二維數(shù)據(jù)框,按照溫度變化排序,取對應(yīng)的三個租賃數(shù)的平均值
應(yīng)用函數(shù):直接應(yīng)用plt的plot函數(shù)即可完成折線圖
第三步
參數(shù)設(shè)置:只需要設(shè)置折線圖的標(biāo)題,其他參數(shù)默認(rèn)
humidity_df = Bikedata.groupby(['humidity'],as_index=True).agg({'count':'mean','registered':'mean','casual':'mean'})
humidity_df.plot(title='Average number of rentals initiated per hour in different humidity')
0xe582400> 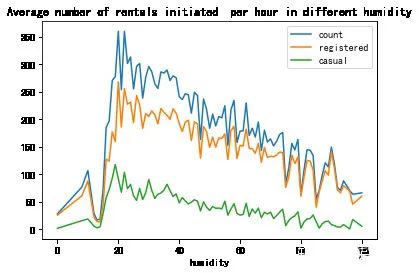
可以觀察到在濕度20左右租賃數(shù)量迅速達(dá)到高峰值,此后緩慢遞減。
年份,月份和季節(jié)作圖方法類似,都采用折線圖繪制,這里省略。
4
查看不同天氣對出行情況的影響
第一步
提出問題:租賃總量對應(yīng)濕度的變化趨勢
適合圖形:因?yàn)樘鞖馇闆r屬于數(shù)值型分類變量,我們可以選擇柱形圖觀察數(shù)量分布
第二步
轉(zhuǎn)換數(shù)據(jù):我們需要一個二維數(shù)據(jù)框,按照天氣情況對租賃數(shù)量取平均值
應(yīng)用函數(shù):應(yīng)用plt的plot.bar函數(shù)繪制組合柱形圖
第三步
參數(shù)設(shè)置:只需要設(shè)置折線圖的標(biāo)題,其他參數(shù)默認(rèn)
weather_df = Bikedata.groupby(['weather'],as_index=True).agg({'registered':'mean','casual':'mean'})
weather_df.plot.bar(stacked=True,title='Average number of rentals initiated per hour in different weather')
0xe7e0a90> 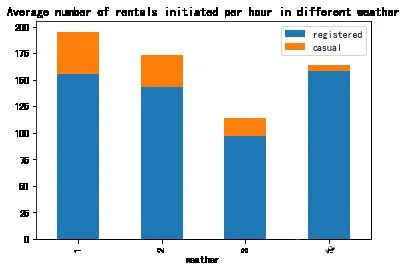
觀察到天氣等級為4時,平均出行人數(shù)比天氣等級為2是還要高,這不符合常理
我們查看一下天氣等級為4的詳細(xì)情況
count_weather = Bikedata.groupby('weather')
count_weather[['casual','registered','count']].count()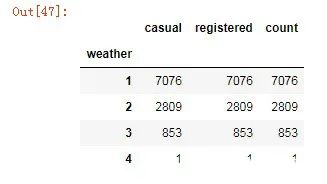
天氣狀況為4級的只有一天,我們把數(shù)據(jù)打印出來查看一下
Bikedata[Bikedata['weather']==4]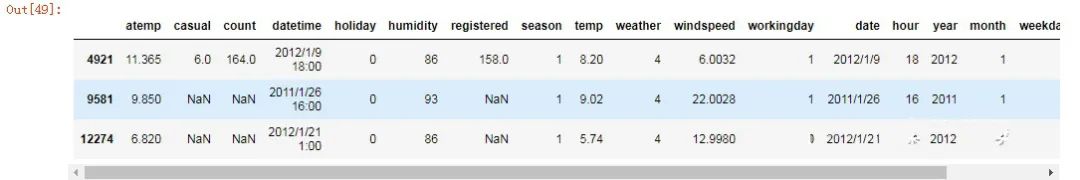
時間為工作日的下午六點(diǎn)鐘,屬于晚高峰異常數(shù)據(jù),不具有代表性。
5
會員用戶和臨時用戶在整體用戶中占比
第一步
提出問題:查看會員用戶和臨時用戶在整體用戶中的比例
適合圖形:查看占比,適合用餅圖pie
第二步
轉(zhuǎn)換數(shù)據(jù):需要一個二維數(shù)據(jù)框,按天數(shù)取兩種用戶的平均值
應(yīng)用函數(shù):應(yīng)用plt的plot.pie函數(shù)繪制餅圖
第三步
參數(shù)設(shè)置:這是數(shù)據(jù)標(biāo)簽和類別標(biāo)簽
#考慮到相同日期是否工作日,星期幾,以及所屬年份等信息是一樣的,把租賃數(shù)據(jù)按天求和,其它日期類數(shù)據(jù)取平均值
day_df = Bikedata.groupby(['date'], as_index=False).agg({'casual':'sum','registered':'sum','count':'sum', 'workingday':'mean','weekday':'mean','holiday':'mean','year':'mean'})
day_df.head()
#按天取兩種類型用戶平均值
number_pei=day_df[['casual','registered']].mean()
number_pei
casual 517.411765
registered 2171.067031
dtype: float64
#繪制餅圖
plt.axes(aspect='equal')
plt.pie(number_pei, labels=['casual','registered'], autopct='%1.1f%%', pctdistance=0.6 , labeldistance=1.05 , radius=1 )
plt.title('Casual or registered in the total lease')
Text(0.5,1,'Casual or registered in the total lease')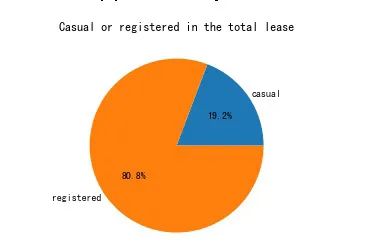
python作圖的簡單案例
6
總結(jié)
要清楚自己想表達(dá)什么,有了明確的問題,選擇合適的圖形,然后按照需求從整體數(shù)據(jù)中選擇自己需要的數(shù)據(jù),查閱資料了解函數(shù)的參數(shù)設(shè)置,最后完成圖形的繪制
matplotlib是python繪圖的基礎(chǔ),也是其他拓展包的基礎(chǔ),認(rèn)真學(xué)習(xí)matplotlib的常用圖形和參數(shù)是很有必要的
學(xué)習(xí)期間思考為什么要加載matplotlib.pyplot?來進(jìn)行繪圖
-?END -
本文為轉(zhuǎn)載分享&推薦閱讀,若侵權(quán)請聯(lián)系后臺刪除
掃一掃下面的二維碼 一起學(xué)習(xí)進(jìn)步哦~~
“掃一掃,領(lǐng)取Python學(xué)習(xí)資料”