
【Python】Matplotlib 可視化進(jìn)階之動畫
使用matplotlib可以很容易地創(chuàng)建動畫框架。我們從一個非常簡單的動畫開始。
matplotlib 動畫
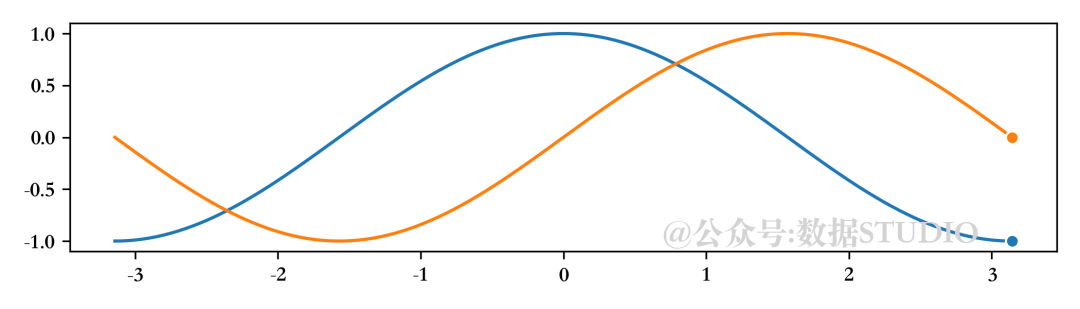
我們想制作一個動畫,其中正弦和余弦函數(shù)在屏幕上逐步繪制。首先需要告訴matplotlib我們想要制作一個動畫,然后必須指定想要在每一幀繪制什么。一個常見的錯誤是重新繪制每一幀的所有內(nèi)容,這會使整個過程非常緩慢。相反地,只能更新必要的內(nèi)容,因為我們知道許多內(nèi)容不會隨著幀的變化而改變。對于折線圖,我們將使用set_data方法更新繪圖,剩下的工作由matplotlib完成。
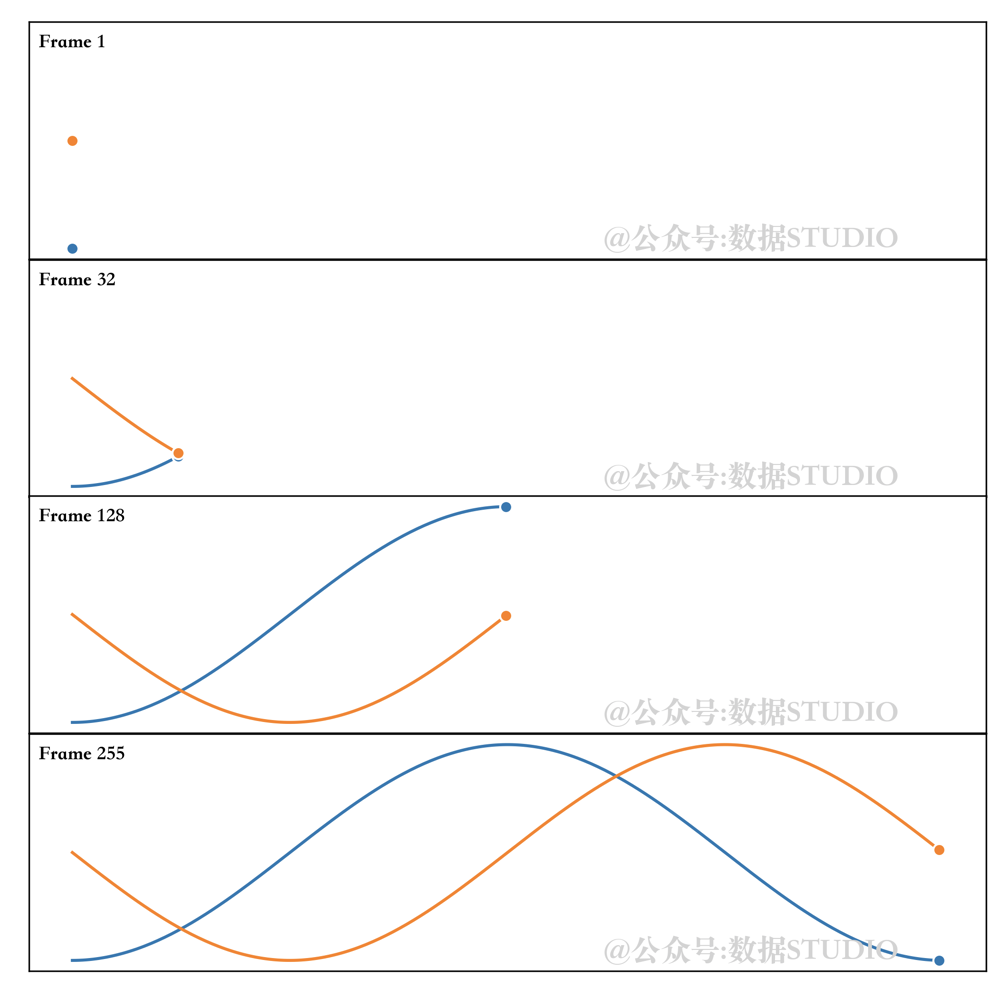
注意隨著動畫移動的終點標(biāo)記。原因是我們在末尾指定了一個標(biāo)記(markevery=[-1]),這樣每次我們設(shè)置新數(shù)據(jù)時,標(biāo)記就會自動更新并隨著動畫移動。參見下圖。
import?numpy?as?np
import?matplotlib.pyplot?as?plt
import?matplotlib.animation?as?animation

fig?=?plt.figure(figsize=(7,?2))
ax?=?plt.subplot()

X?=?np.linspace(-np.pi,?np.pi,?256,?endpoint=True)
C,?S?=?np.cos(X),?np.sin(X)
(line1,)?=?ax.plot(X,?C,?marker="o",?markevery=[-1],?
???????????????????markeredgecolor="white")
(line2,)?=?ax.plot(X,?S,?marker="o",?markevery=[-1],?
???????????????????markeredgecolor="white")

def?update(frame):
????line1.set_data(X[:frame],?C[:frame])
????line2.set_data(X[:frame],?S[:frame])

plt.tight_layout()
ani?=?animation.FuncAnimation(fig,?update,?interval=10)
如果我們現(xiàn)在想要保存這個動畫,matplotlib可以創(chuàng)建一個mp4文件,但是選項非常少。一個更好的解決方案是使用外部庫,如FFMpeg,它可以在大多數(shù)系統(tǒng)上使用。安裝完成后,我們可以使用專用的FFMpegWriter,如下圖所示:
writer?=?animation.FFMpegWriter(fps=30)
anim?=?animation.FuncAnimation(fig,?update,?
???????????????????????????????interval=10,
???????????????????????????????frames=len(X))
anim.save("sine-cosine.mp4",?writer=writer,?dpi=100)
注意,當(dāng)我們保存mp4動畫時,動畫不會立即開始,因為實際上有一個與影片創(chuàng)建相對應(yīng)的延遲。對于正弦和余弦,延遲相當(dāng)短,可以忽略。但對于長且復(fù)雜的動畫,這種延遲會變得非常重要,因此有必要跟蹤其進(jìn)展。因此我們使用tqdm庫添加一些信息。
from?tqdm.autonotebook?import?tqdm
bar?=?tqdm(total=len(X))?
anim.save("../data/sine-cosine.mp4",?
??????????writer=writer,?dpi=300,
??????????progress_callback?=?lambda?i,?n:?bar.update(1))?
bar.close()

[Errno 2] No such file or directory: 'ffmpeg'
如果你在 macOS 上,只需通過 homebrew 安裝它:
brew install ffmpeg
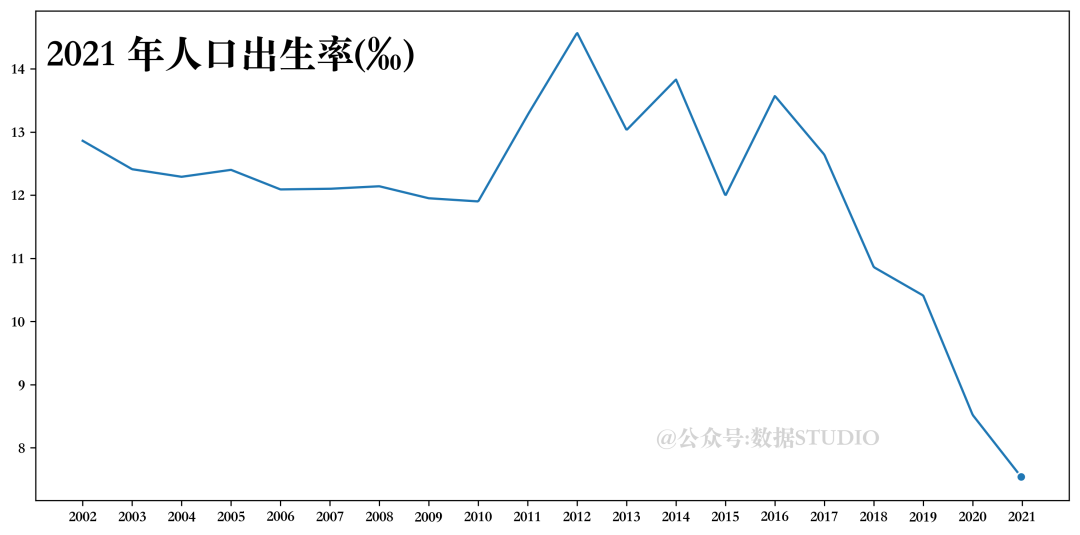
人口出生率
x?=?data['指標(biāo)'].values
rate=?data['人口出生率(‰)']
y?=?rate.values
xvals?=?np.linspace(2002,2021,1000)
yinterp?=?np.interp(xvals,x,y)
(line1,)?=?ax.plot(xvals,?yinterp,?marker="o",?
???????????????????markevery=[-1],?markeredgecolor="white")
text?=?ax.text(0.01,?0.95,'text',?ha="left",?va="top",?
???????????????transform=ax.transAxes,?size=25)
ax.set_xticks(x)

def?update(frame):
????line1.set_data(xvals[:frame],?yinterp[:frame])
????text.set_text("%d?年人口出生率(‰)?"?%?int(xvals[frame]))
????return?line1,?text
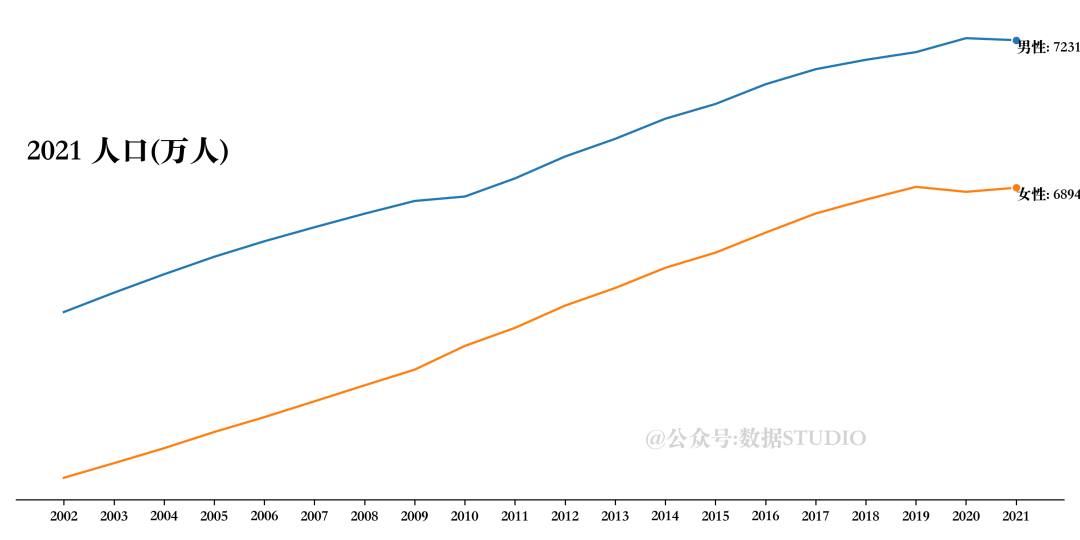
男女人口總數(shù)
#?設(shè)置畫布
fig?=?plt.figure(figsize=(10,?5))
ax?=?plt.subplot()
#?數(shù)據(jù)準(zhǔn)備
X?=?data['指標(biāo)']
male,?female?=data['男性人口(萬人)'],?data['女性人口(萬人)']
#?繪制折線圖
(line1,)?=?ax.plot(X,?male,?marker="o",?
???????????????????markevery=[-1],?markeredgecolor="white")
(line2,)?=?ax.plot(X,?female,?marker="o",?
???????????????????markevery=[-1],?markeredgecolor="white")
#?設(shè)置圖形注釋
text?=?ax.text(0.01,?0.75,'text',?
???????????????ha="left",?va="top",?
???????????????transform=ax.transAxes,size=20)
text2?=?ax.text(X[0],male[0],?'',?ha="left",?va="top")
text3?=?ax.text(X[0],female[0],?'',?ha="left",?va="top")
#?設(shè)置坐標(biāo)軸刻度標(biāo)簽
ax.set_xticks(X)
ax.set_yticks([])
#?設(shè)置坐標(biāo)軸線格式
ax.spines["top"].set_visible(False)
ax.spines["left"].set_visible(False)
ax.spines["right"].set_visible(False)
#?定義更新函數(shù)
def?update(frame):
????line1.set_data(X[:frame+1],?male[:frame+1])
????line2.set_data(X[:frame+1],?female[:frame+1])
????text.set_text("%d?人口(萬人)"?%?X[frame])
????text2.set_position((X[frame],?male[frame]))
????text2.set_text(f'男性:?{male[frame]}')
????text3.set_position((X[frame],?female[frame]))
????text3.set_text(f'女性:?{female[frame]}')
????return?line1,line2,?text
#?定義輸出
plt.tight_layout()
writer?=?animation.FFMpegWriter(fps=5)
#?執(zhí)行動畫
anim?=?animation.FuncAnimation(fig,?update,?interval=500,?frames=len(X))
#?存儲動畫
#?設(shè)置進(jìn)度條
bar?=?tqdm(total=len(X))
anim.save(
????"num_people2.mp4",
????writer=writer,
????dpi=300,
????progress_callback=lambda?i,?n:?bar.update(1),
)
#?關(guān)閉進(jìn)度條
bar.close()
雨滴

#?設(shè)置雨滴繪圖更新函數(shù)
def?rain_update(frame):
????global?R,?scatter
??#?數(shù)據(jù)獲取
????R["color"][:,?3]?=?np.maximum(0,?R["color"][:,?3]?-?1?/?len(R))
????R["size"]?+=?1?/?len(R)

????i?=?frame?%?len(R)
????R["position"][i]?=?np.random.uniform(0,?1,?2)
????R["size"][i]?=?0
????R["color"][i,?3]?=?1
????#?散點形狀設(shè)置
????scatter.set_edgecolors(R["color"])
????scatter.set_sizes(1000?*?R["size"].ravel())
????scatter.set_offsets(R["position"])
????return?(scatter,)
#?繪制畫布
fig?=?plt.figure(figsize=(6,?8),?facecolor="white",?dpi=300)
ax?=?fig.add_axes([0,?0,?1,?1],?frameon=False)??#?,?aspect=1)
#?繪制初始化散點圖
scatter?=?ax.scatter([],?[],?s=[],?
?????????????????????linewidth=0.5,?edgecolors=[],?
?????????????????????facecolors="None",cmap='rainbow')
#?設(shè)置雨滴數(shù)量
n?=?250
#?為雨滴設(shè)置參數(shù)值
R?=?np.zeros(
????n,?dtype=[("position",?float,?(2,)),?
??????????????("size",?float,?(1,)),
??????????????("color",?float,?(4,))])
R["position"]?=?np.random.uniform(0,?1,?(n,?2))
R["size"]?=?np.linspace(0,?1.5,?n).reshape(n,?1)
R["color"][:,?3]?=?np.linspace(0,?1,?n)
#?設(shè)置坐標(biāo)軸格式
ax.set_xlim(0,?1),?ax.set_xticks([])
ax.set_ylim(0,?1),?ax.set_yticks([])
#?保存同上
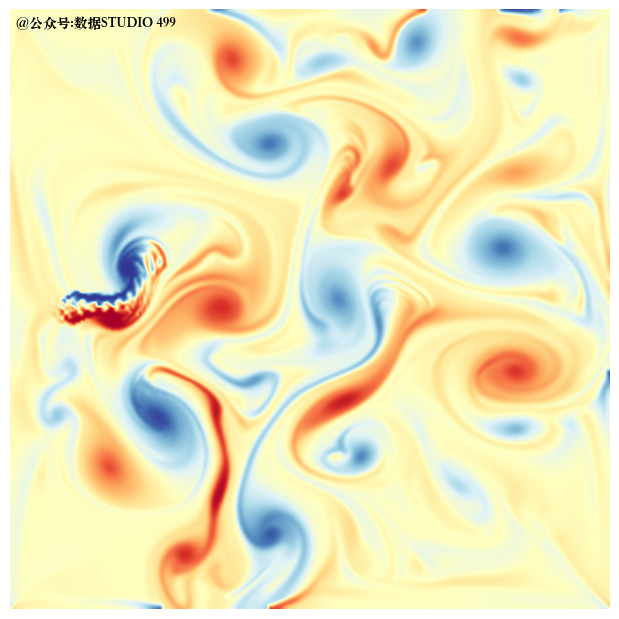
流體
最后一個更加復(fù)雜的流體
參考資料
Scientific Visualisation-Python & Matplotlib

往期精彩回顧