
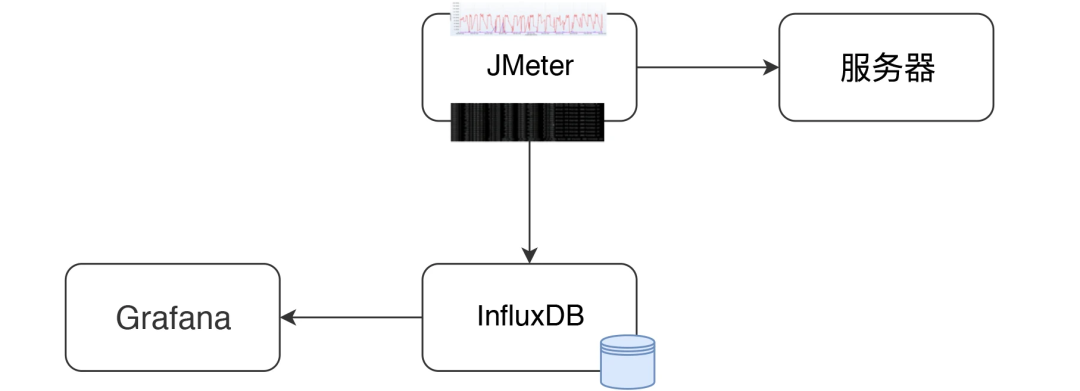
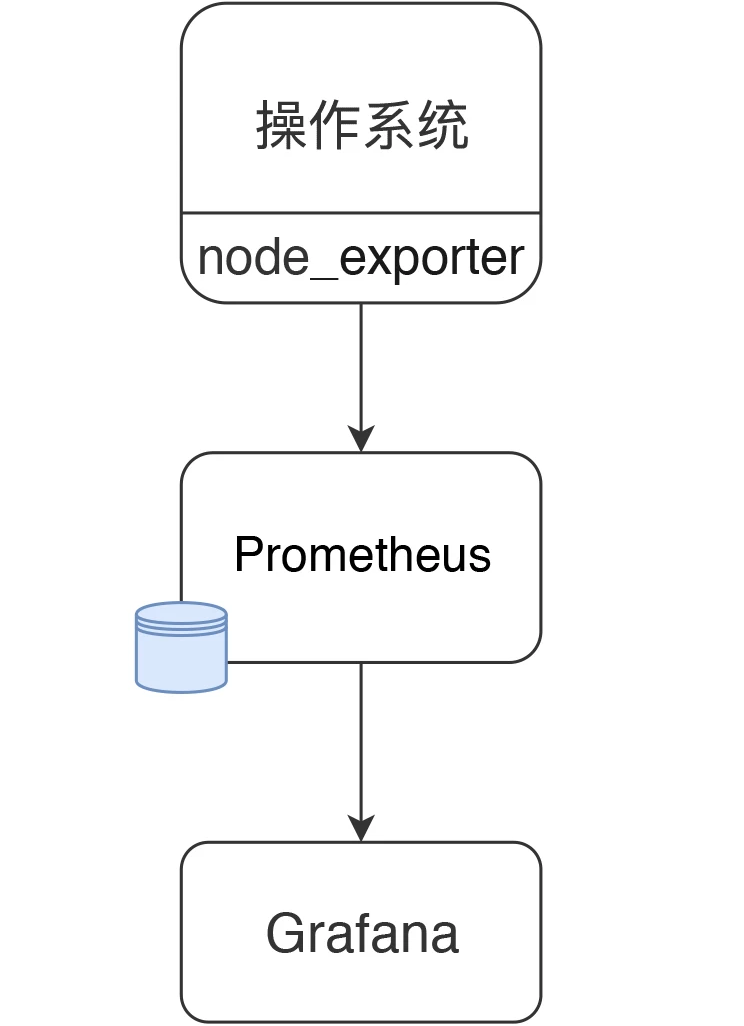
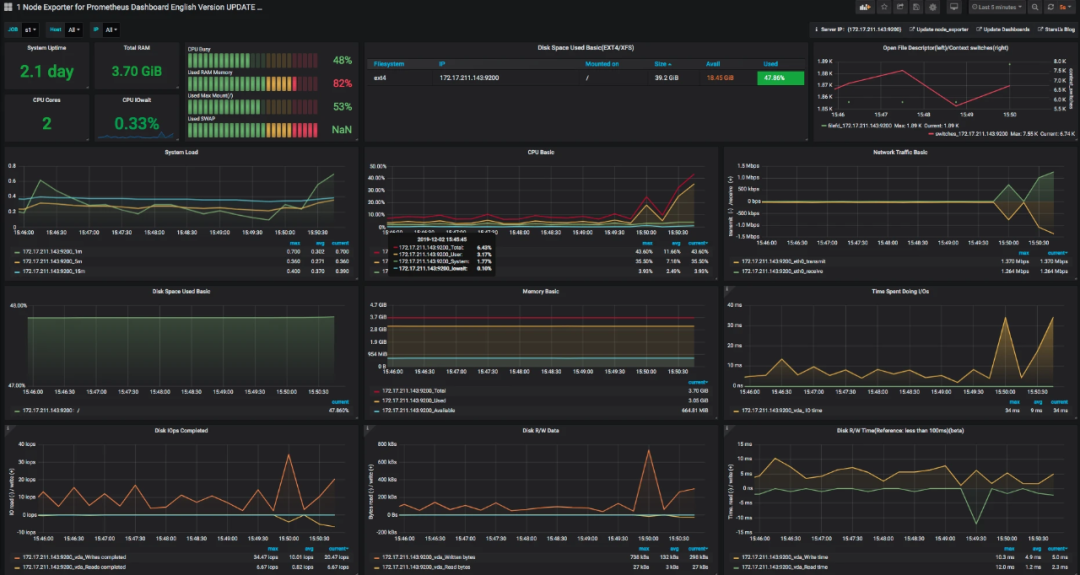
基于 Prometheus、InfluxDB 與 Grafana 打造監(jiān)控平臺(tái)


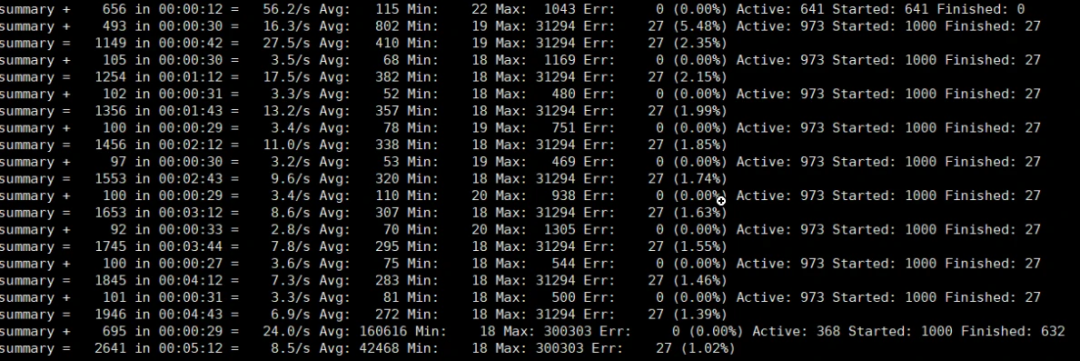
整理結(jié)果時(shí)比較浪費(fèi)時(shí)間。
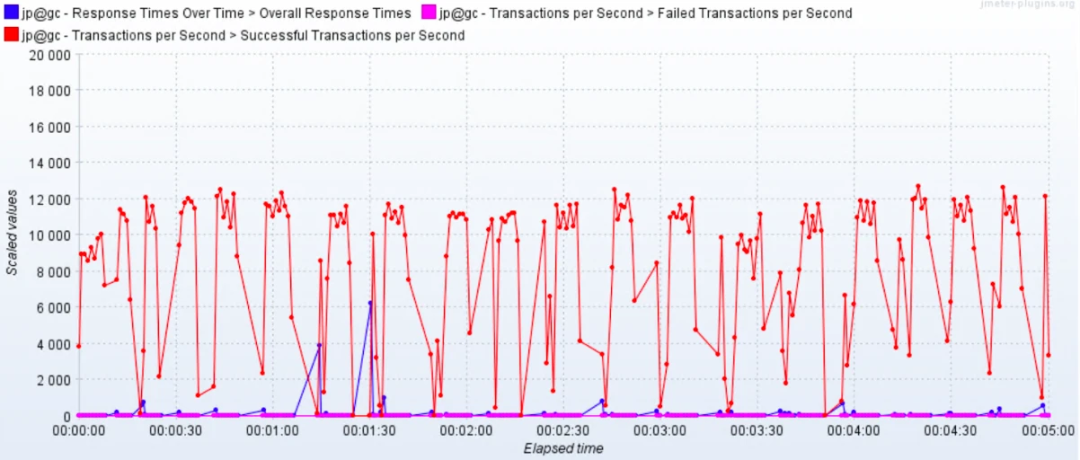
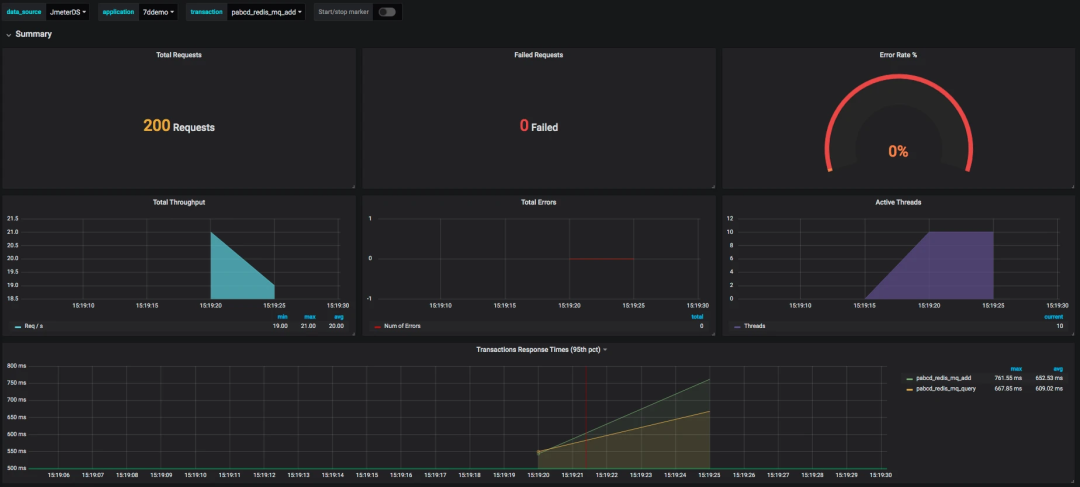
在 GUI 用插件看曲線,做高并發(fā)時(shí)并不現(xiàn)實(shí)。
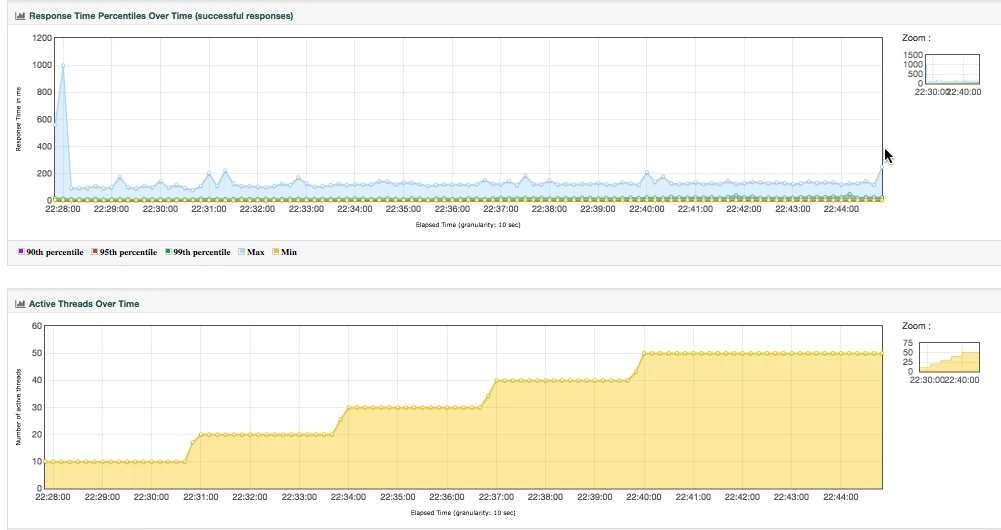
在場景運(yùn)行時(shí)間比較長的時(shí)候,采用生成 HTML 的方式,會(huì)出現(xiàn)消耗內(nèi)存過大的情況,而實(shí)際上,在生成的結(jié)果圖中,有很多生成的圖我們并不是那么關(guān)注。
生成的結(jié)果保存之后再查看比較麻煩,還要一個(gè)個(gè)去找。

private?void?addMetrics(String?transaction,?SamplerMetric?metric)?{
????????//?FOR?ALL?STATUS
????????addMetric(transaction,?metric.getTotal(),?metric.getSentBytes(),?metric.getReceivedBytes(),?TAG_ALL,?metric.getAllMean(),?metric.getAllMinTime(),
????????????????metric.getAllMaxTime(),?allPercentiles.values(),?metric::getAllPercentile);
????????//?FOR?OK?STATUS
????????addMetric(transaction,?metric.getSuccesses(),?null,?null,?TAG_OK,?metric.getOkMean(),?metric.getOkMinTime(),
????????????????metric.getOkMaxTime(),?okPercentiles.values(),?metric::getOkPercentile);
????????//?FOR?KO?STATUS
????????addMetric(transaction,?metric.getFailures(),?null,?null,?TAG_KO,?metric.getKoMean(),?metric.getKoMinTime(),
????????????????metric.getKoMaxTime(),?koPercentiles.values(),?metric::getKoPercentile);


????????metric.getErrors().forEach((error,?count)?->?addErrorMetric(transaction,?error.getResponseCode(),
????????????????????error.getResponseMessage(),?count));
????}
@Override?public?void?writeAndSendMetrics()?{
?........?if?(!copyMetrics.isEmpty())?{?try?{?if(httpRequest?==?null)?{
????????????????????httpRequest?=?createRequest(url);
????????????????}
????????????????StringBuilder?sb?=?new?StringBuilder(copyMetrics.size()*35);?for?(MetricTuple?metric?:?copyMetrics)?{?//?Add?TimeStamp?in?nanosecond?from?epoch?(?default?in?InfluxDB?)
?sb.append(metric.measurement)
????????????????????????.append(metric.tag)
????????????????????????.append("?")?//$NON-NLS-1$
?.append(metric.field)
????????????????????????.append("?")
????????????????????????.append(metric.timestamp+"000000")?
????????????????????????.append("\n");?//$NON-NLS-1$
?}


????????????????StringEntity?entity?=?new?StringEntity(sb.toString(),?StandardCharsets.UTF_8);
????????????????
????????????????httpRequest.setEntity(entity);
????????????????lastRequest?=?httpClient.execute(httpRequest,?new?FutureCallback()?{
????????????????????@Override?public?void?completed(final?HttpResponse?response)?{?int?code?=?response.getStatusLine().getStatusCode();?/*?*?HTTP?response?summary?2xx:?If?your?write?request?received
?????????????????????????*?HTTP?204?No?Content,?it?was?a?success!?4xx:?InfluxDB
?????????????????????????*?could?not?understand?the?request.?5xx:?The?system?is
?????????????????????????*?overloaded?or?significantly?impaired.?*/
????????????????????????if?(MetricUtils.isSuccessCode(code))?{?if(log.isDebugEnabled())?{
????????????????????????????????log.debug("Success,?number?of?metrics?written:?{}",?copyMetrics.size());
????????????????????????????}?
????????????????????????}?else?{
????????????????????????????log.error("Error?writing?metrics?to?influxDB?Url:?{},?responseCode:?{},?responseBody:?{}",?url,?code,?getBody(response));
????????????????????????}
????????????????????}
????????????????????@Override?public?void?failed(final?Exception?ex)?{
????????????????????????log.error("failed?to?send?data?to?influxDB?server?:?{}",?ex.getMessage());
????????????????????}
????????????????????@Override?public?void?cancelled()?{
????????????????????????log.warn("Request?to?influxDB?server?was?cancelled");
????????????????????}
????????????????});???????????????
?........
????????????}
????????}
????}
>?show?databases??
name:?databases??
name??
----??
_internal??
jmeter??
>?use?jmeter??
Using?database?jmeter??
>??
>?show?MEASUREMENTS??
name:?measurements??
name??
----??
events??
jmeter??
>?select?*?from?events?where?application='7ddemo'??
name:?events??
time?application?text?title??
----?-----------?----?-----??
1575255462806000000?7ddemo?Test?Cycle1?started?ApacheJMeter??
1575256463820000000?7ddemo?Test?Cycle1?ended?ApacheJMeter??
..............??
n>?select?*?from?jmeter?where?application='7ddemo'?limit?10??
name:?jmeter??
time?application?avg?count?countError?endedT?hit?max?maxAT?meanAT?min?minAT?pct90.0?pct95.0?pct99.0?rb?responseCode?responseMessage?sb?startedT?statut?transaction??
----?-----------?---?-----?----------?------?---?---?-----?------?---?-----?-------?-------?-------?--?------------?---------------?--?--------?------?-----------??
1575255462821000000?7ddemo?0?0?0?0?0?internal??
1575255467818000000?7ddemo?232.82352941176472?17?0?17?849?122?384.9999999999996?849?849?0?0?all?all??
1575255467824000000?7ddemo?232.82352941176472?17?849?122?384.9999999999996?849?849?0?0?all?0_openIndexPage??
1575255467826000000?7ddemo?232.82352941176472?17?849?122?384.9999999999996?849?849?ok?0_openIndexPage??
1575255467829000000?7ddemo?0?1?1?1?1?internal??
1575255472811000000?7ddemo?205.4418604651163?26?0?26?849?122?252.6?271.4?849?0?0?all?all??
1575255472812000000?7ddemo?0?1?1?1?1?internal??
1575255472812000000?7ddemo?205.4418604651163?26?849?122?252.6?271.4?849?ok?0_openIndexPage??
1575255472812000000?7ddemo?205.4418604651163?26?849?122?252.6?271.4?849?0?0?all?0_openIndexPage??
1575255477811000000?7ddemo?198.2142857142857?27?0?27?849?117?263.79999999999995?292.3500000000001?849?0?0?all?all

SELECT?last("count")?/?$send_interval?FROM?"$measurement_name"?WHERE?("transaction"?=~?/^$transaction$/?AND?"statut"?=?'ok')?AND?$timeFilter?GROUP?BY?time($__interval)
SELECT?mean("pct95.0")?FROM?"$measurement_name"?WHERE?("application"?=~?/^$application$/)?AND?$timeFilter?GROUP?BY?"transaction",?time($__interval)?fill(null)


[root@7dgroup2?node_exporter-0.18.1.linux-amd64]#?ll??
total?16524??
-rw-r--r--?1?3434?3434?11357?Jun?5?00:50?LICENSE??
-rwxr-xr-x?1?3434?3434?16878582?Jun?5?00:41?node_exporter??
-rw-r--r--?1?3434?3434?463?Jun?5?00:50?NOTICE}
[root@7dgroup2?node_exporter-0.18.1.linux-amd64]#./node_exporter?--web.listen-address=:9200?&
[root@7dgroup2?data]#?wget?-c?https://github.com/prometheus/prometheus/releases/download/v2.14.0/prometheus-2.14.0.linux-amd64.tar.gz??
..........??
100%[=============================================================================================>]?58,625,125?465KB/s?in?6m?4s

??
2019-11-29?15:40:16?(157?KB/s)?-?‘prometheus-2.14.0.linux-amd64.tar.gz’?saved?[58625125/58625125]

??
[root@7dgroup2?data]
[root@7dgroup2?prometheus-2.11.1.linux-amd64]#?ll??
total?120288??
drwxr-xr-x.?2?3434?3434?4096?Jul?10?23:26?console_libraries??
drwxr-xr-x.?2?3434?3434?4096?Jul?10?23:26?consoles??
drwxr-xr-x.?3?root?root?4096?Nov?30?12:55?data??
-rw-r--r--.?1?3434?3434?11357?Jul?10?23:26?LICENSE??
-rw-r--r--.?1?root?root?35?Aug?7?23:19?node.yml??
-rw-r--r--.?1?3434?3434?2770?Jul?10?23:26?NOTICE??
-rwxr-xr-x.?1?3434?3434?76328852?Jul?10?21:53?prometheus??
-rw-r--r--?1?3434?3434?1864?Sep?21?09:36?prometheus.yml??
-rwxr-xr-x.?1?3434?3434?46672881?Jul?10?21:54?promtool??
[root@7dgroup2?prometheus-2.11.1.linux-amd64]#
-?job_name:?'s1'??
static_configs:??
-?targets:?['172.17.211.143:9200']
[root@7dgroup2?data]#?./prometheus?--config.file=prometheus.yml?&
avg(irate(node_cpu_seconds_total{instance=~"$node",mode="system"}[30m]))?by?(instance)?avg(irate(node_cpu_seconds_total{instance=~"$node",mode="user"}[30m]))?by?(instance)?avg(irate(node_cpu_seconds_total{instance=~"$node",mode="iowait"}[30m]))?by?(instance)?1?-?avg(irate(node_cpu_seconds_total{instance=~"$node",mode="idle"}[30m]))?by?(instance)

03
Prometheus+Zabbix實(shí)戰(zhàn)訓(xùn)練營
馬永亮:開源技術(shù)愛好者及布道師
張士杰:十年資深架構(gòu)師
12講Prometheus+17講Zabbix,最低僅需¥0.2

2人拼團(tuán)價(jià)9.9元,5人拼團(tuán)價(jià)0.2元
掃碼開啟拼團(tuán)
詳細(xì)課程內(nèi)容請(qǐng)看下圖
點(diǎn)擊「閱讀原文」
直接開啟拼團(tuán)
最低僅需?¥0.2?拿下?29節(jié)在線好課