
Spring Boot + Prometheus + Grafana 打造可視化監(jiān)控,一目了然!
點擊關(guān)注公眾號,Java干貨及時送達??

作者:煙味i
鏈接:https://www.cnblogs.com/2YSP/p/12827487.html
一、背景
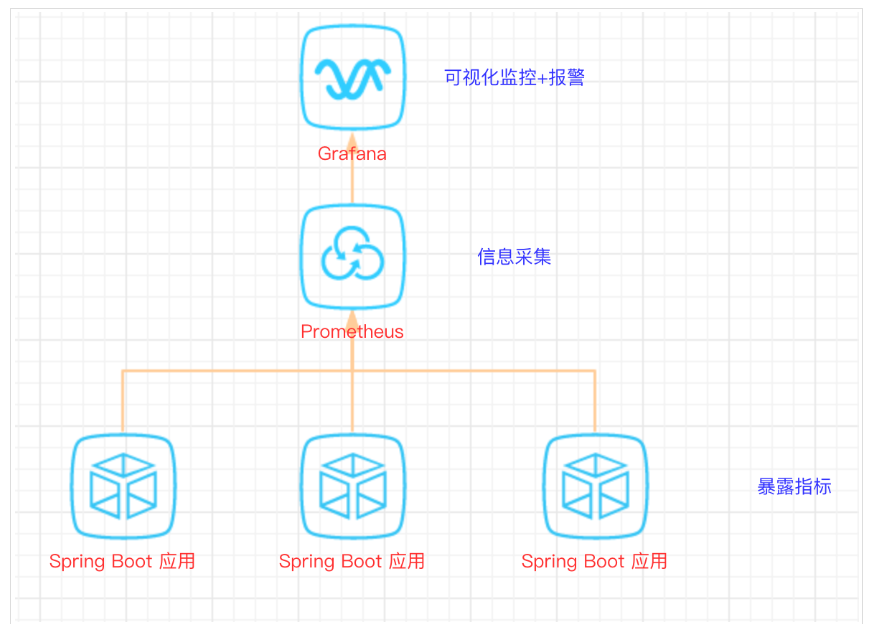
SpringBoot的應(yīng)用監(jiān)控方案比較多,SpringBoot+Prometheus+Grafana是目前比較常用的方案之一。它們?nèi)咧g的關(guān)系大概如下圖:
二、開發(fā)SpringBoot應(yīng)用
首先,創(chuàng)建一個SpringBoot項目,pom文件如下:
<dependency>
????????????<groupId>org.springframework.bootgroupId>
????????????<artifactId>spring-boot-starter-actuatorartifactId>
????????dependency>
????????<dependency>
????????????<groupId>org.springframework.bootgroupId>
????????????<artifactId>spring-boot-starter-webartifactId>
????????dependency>

????????<dependency>
????????????<groupId>org.projectlombokgroupId>
????????????<artifactId>lombokartifactId>
????????????<optional>trueoptional>
????????dependency>

????????
????????<dependency>
????????????<groupId>io.prometheusgroupId>
????????????<artifactId>simpleclient_spring_bootartifactId>
????????????<version>0.8.1version>
????????dependency>

????????<dependency>
????????????<groupId>org.springframework.bootgroupId>
????????????<artifactId>spring-boot-starter-securityartifactId>
????????dependency>
注意: 這里的SpringBoot版本是1.5.7.RELEASE,之所以不用最新的2.X是因為最新的simpleclient_spring_boot只支持1.5.X,不確定2.X版本的能否支持。
MonitorDemoApplication啟動類增加注解
package?cn.sp;?
?
import?io.prometheus.client.spring.boot.EnablePrometheusEndpoint;?
import?io.prometheus.client.spring.boot.EnableSpringBootMetricsCollector;?
import?org.springframework.boot.SpringApplication;?
import?org.springframework.boot.autoconfigure.SpringBootApplication;?
@EnablePrometheusEndpoint?
@EnableSpringBootMetricsCollector?
@SpringBootApplication?
public?class?MonitorDemoApplication?{?
?
????public?static?void?main(String[]?args)?{?
????????SpringApplication.run(MonitorDemoApplication.class,?args);?
????}?
?
}?
配置文件application.yml
server:?
??port:?8848?
spring:?
??application:?
????name:?monitor-demo?
?
security:?
??user:?
????name:?admin?
????password:?1234?
??basic:?
????enabled:?true?
????#?安全路徑列表,逗號分隔,此處只針對/admin路徑進行認(rèn)證?
????path:?/admin?
?
#?actuator暴露接口的前綴?
management:?
??context-path:?/admin?
??#?actuator暴露接口使用的端口,為了和api接口使用的端口進行分離?
??port:?8888?
??security:?
????enabled:?true?
????roles:?SUPERUSER
測試代碼TestController
@RequestMapping("/heap/test")
@RestController
public?class?TestController?{

????public?static?final?Map?map?=?new?ConcurrentHashMap<>();

????@RequestMapping("")
????public?String?testHeapUsed()?{
????????for?(int?i?=?0;?i?????????????map.put(i?+?"",?new?Object());
????????}
????????return?"ok";
????}
}
這里的邏輯就是在請求這個接口后,創(chuàng)建大量對象保存到map中增加堆內(nèi)存使用量,方便后面測試郵件報警。
啟動項目后,可以在IDEA中看到有很多Endpoints,如圖:
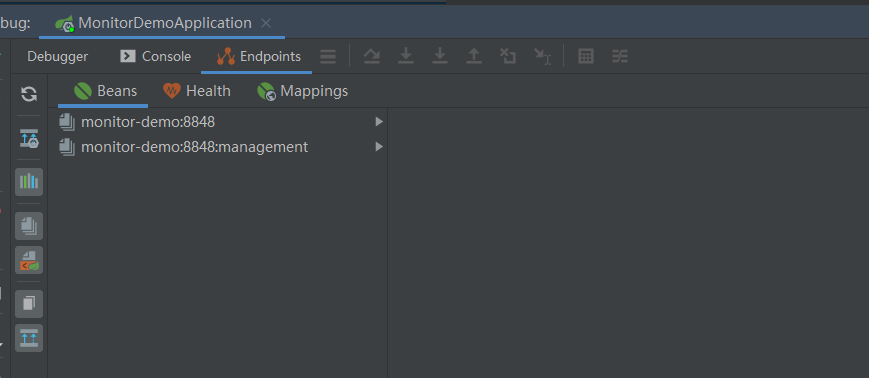
開始我的IDEA是不顯示這個Endpoints,后來發(fā)現(xiàn)是我使用的idea版本太老了,還是2017.1的, 而這個需要 idea2017.2版本以上才能看到。后來只好重新下載安裝,弄了好久。。。。
啟動完畢,訪問http://localhost:8888/admin/prometheus就可以看到服務(wù)暴露的那些監(jiān)控指標(biāo)了。
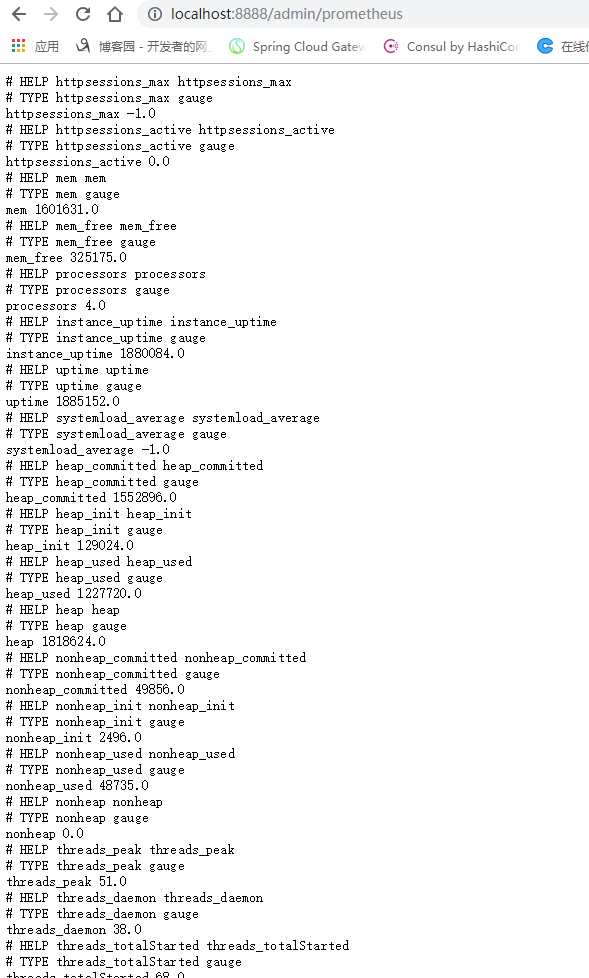
監(jiān)控指標(biāo)
注意:
由于開啟了安全認(rèn)證,所以訪問這個URL的需要提示輸入賬號/密碼,如果提示404請檢查下你的請求地址是否正確,如果不設(shè)置management.context-path則默認(rèn)地址是http://ip:port/prometheus
三、安裝Prometheus
下載地址https://prometheus.io/download/,本文下載的是Windows版本prometheus-2.17.2.windows-amd64.tar.gz。
解壓后修改prometheus.yml文件,配置數(shù)據(jù)采集的目標(biāo)信息。
scrape_configs:?
??#?The?job?name?is?added?as?a?label?`job=`?to?any?timeseries?scraped?from?this?config.?
??#?-?job_name:?'prometheus'?
?
????#?metrics_path?defaults?to?'/metrics'?
????#?scheme?defaults?to?'http'.?
?
????#?static_configs:?
????#?-?targets:?['localhost:9090']?
??-?job_name:?'monitor-demo'?
????scrape_interval:?5s?#?刮取的時間間隔?
????scrape_timeout:?5s??
????metrics_path:?/admin/prometheus?
????scheme:?http??
????basic_auth:?#認(rèn)證信息?
??????username:?admin?
??????password:?1234?
????static_configs:?
??????-?targets:?
????????-?127.0.0.1:8888??#此處填寫?Spring?Boot?應(yīng)用的?IP?+?端口號?
更多配置信息請查看官方文檔。
現(xiàn)在可以啟動Prometheus了,命令行輸入:prometheus.exe --config.file=prometheus.yml 訪問http://localhost:9090/targets,查看Spring Boot采集狀態(tài)是否正常。
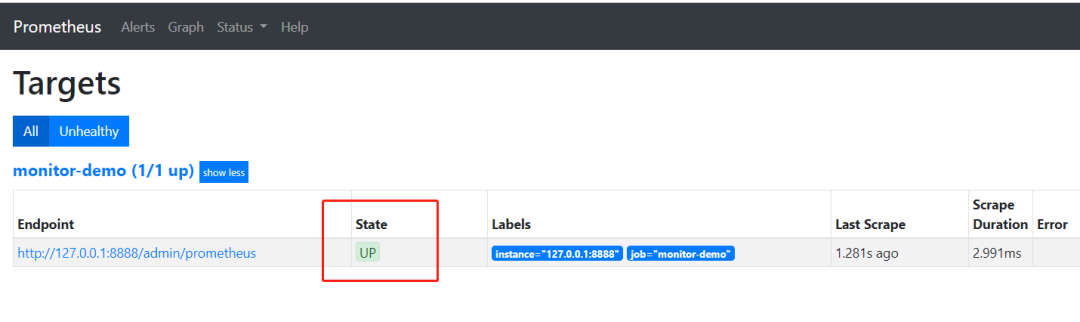
采集目標(biāo)信息
四、安裝Grafana
下載地址https://grafana.com/grafana/download,本文用到的是Windows版本grafana-6.3.3.windows-amd64.zip。
解壓后運行bin目錄下的grafana-server.exe啟動,游覽器訪問http://localhost:3000即可看到登錄頁面,默認(rèn)賬號密碼是admin/admin。
現(xiàn)在開始創(chuàng)建自己的可視化監(jiān)控面板。
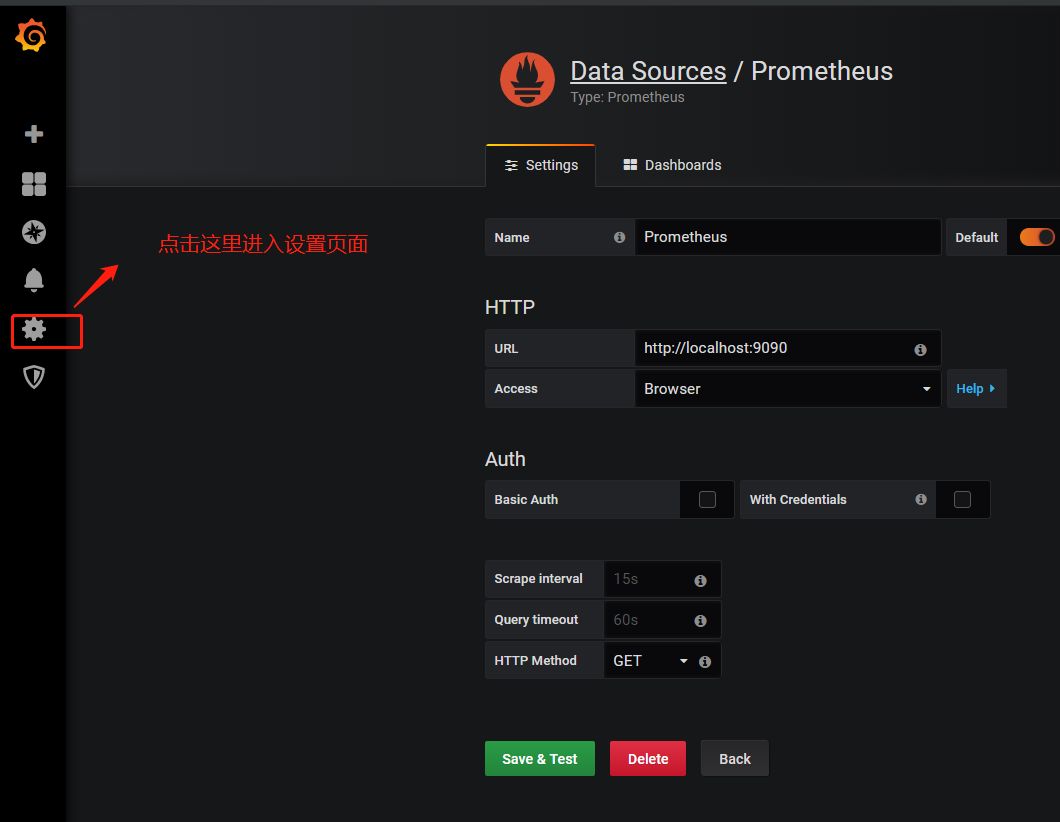
1.設(shè)置數(shù)據(jù)源
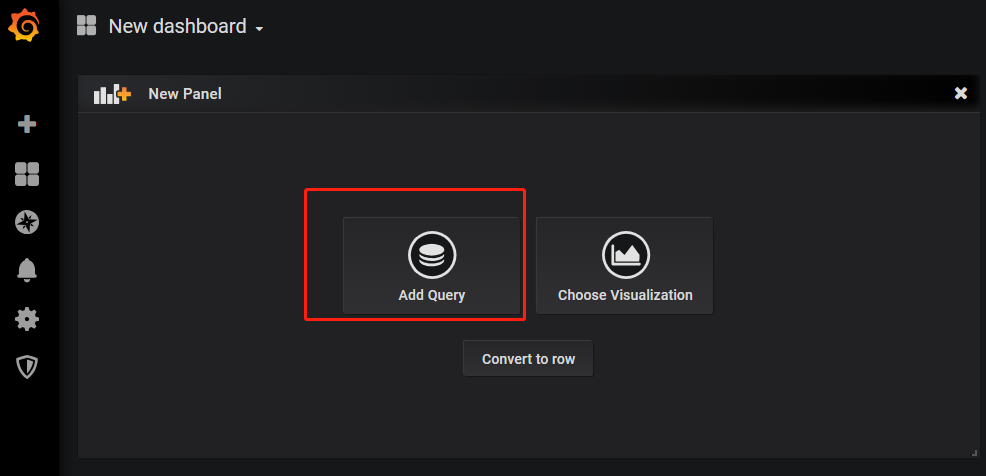
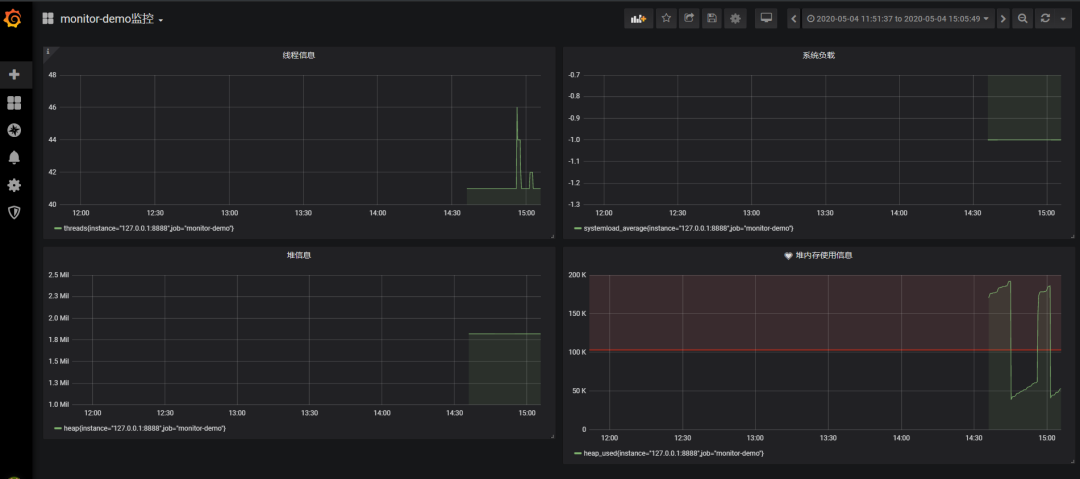
2. 創(chuàng)建一個Dashboard
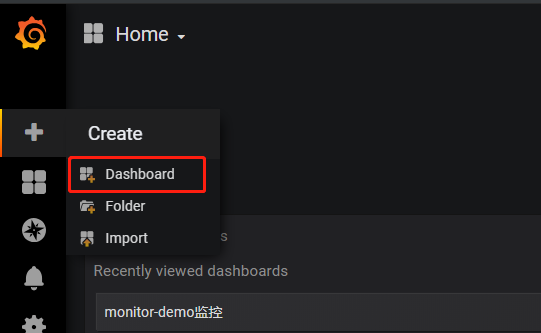
enter description here
3. 填寫采集的指標(biāo)點
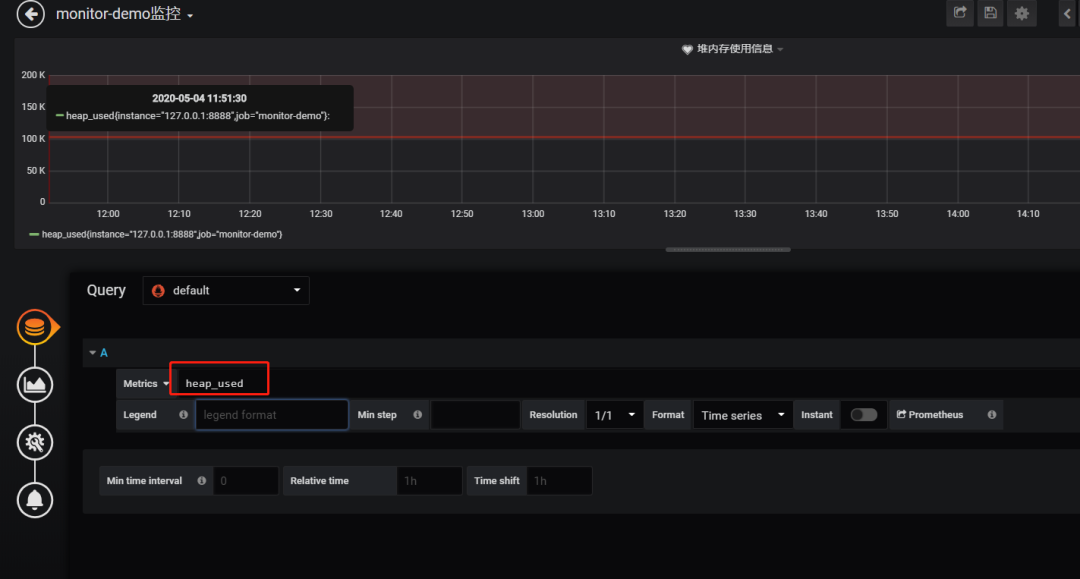
注意: 這里的指標(biāo)點不能隨便填,必須是已有的可以在 Prometheus看到。
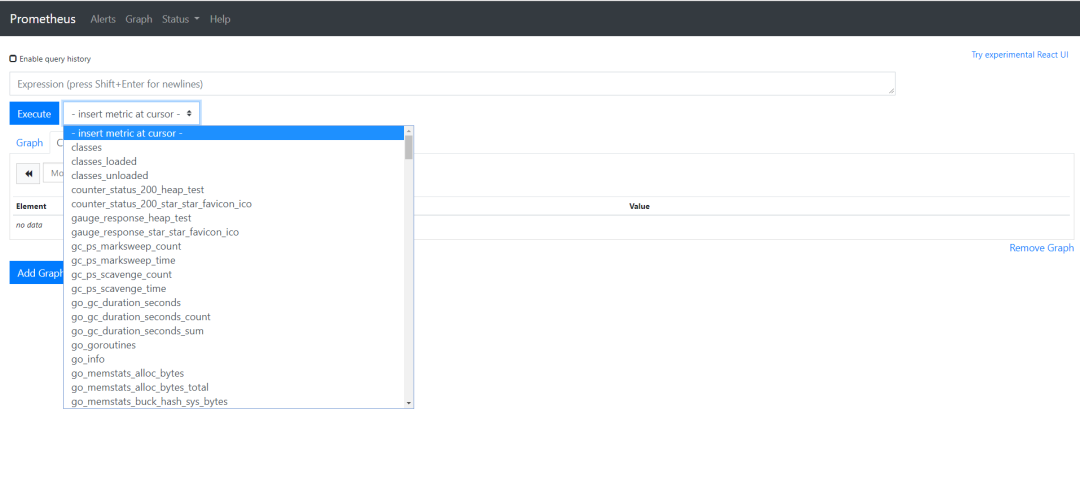
采集指標(biāo)
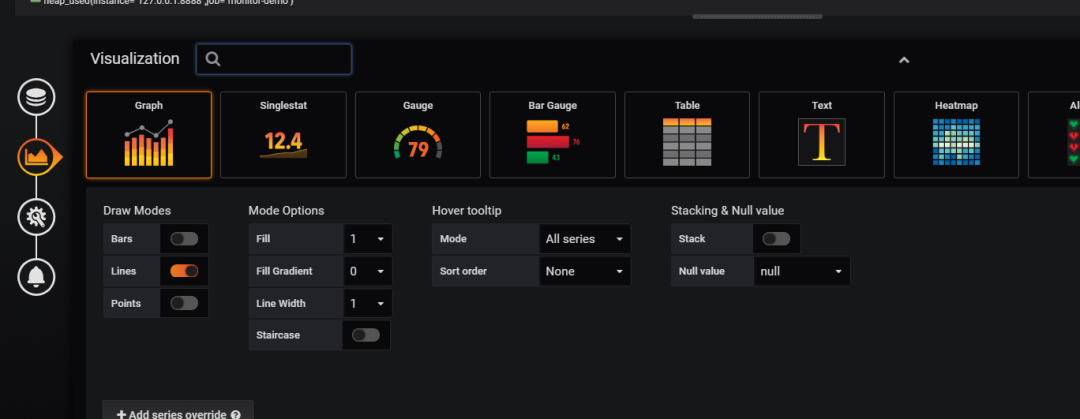
4.選擇圖表樣式
5.填寫標(biāo)題描述
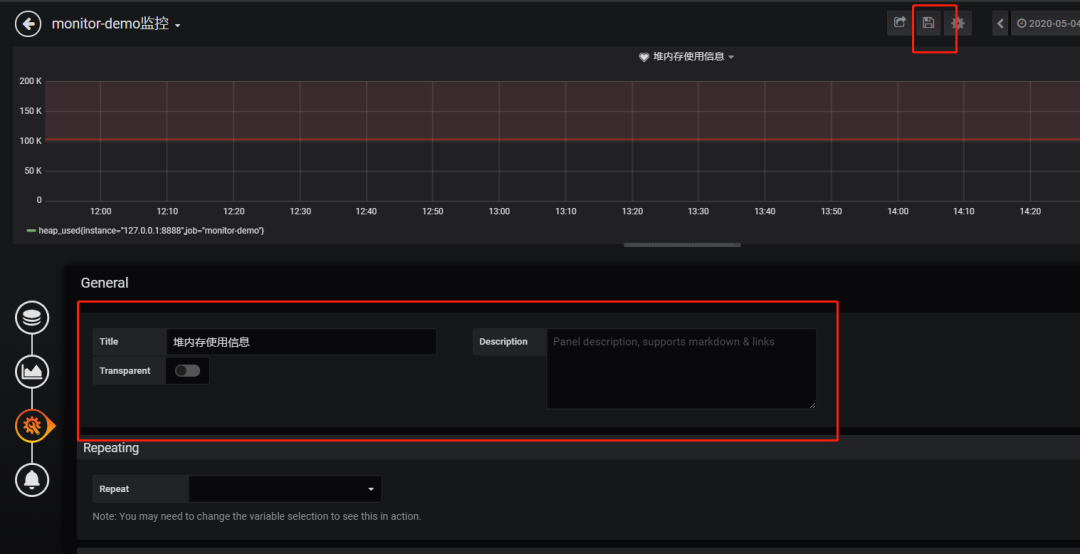
最后點擊右上角的保存,輸入Dashboad的名稱即可。
Tips: 這里的圖表布局是可以用鼠標(biāo)拖動的
五、添加郵件報警
在實際項目中當(dāng)監(jiān)控的某的個指標(biāo)超過閾值(比如CPU使用率過高),希望監(jiān)控系統(tǒng)自動通過短信、釘釘和郵件等方式報警及時通知運維人員,Grafana就支持該功能。
第一步: 點擊[Alerting]——>[Notification channels]添加通知通道
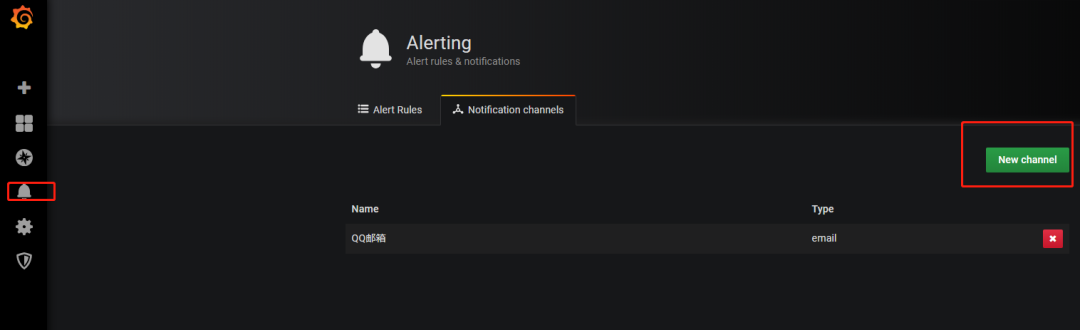
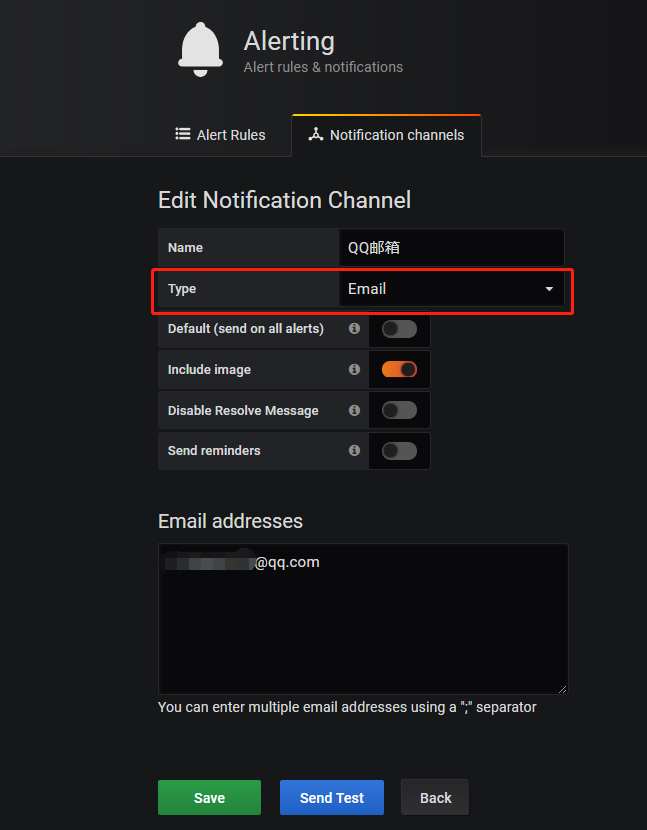
這里的Type有很多選項,包括webhook、釘釘?shù)龋@里以郵件為例。
第二步: 郵箱配置
Grafana默認(rèn)使用conf目錄下defaults.ini作為配置文件運行,根據(jù)官方的建議我們不要更改defaults.ini而是在同級目錄下新建一個配置文件custom.ini。以騰訊企業(yè)郵箱為例,配置如下:
####################################?SMTP?/?Emailing?#####################
[smtp]
enabled?=?true
host?=?smtp.exmail.qq.com:465
[email protected]
#?If?the?password?contains?#?or?;?you?have?to?wrap?it?with?triple?quotes.?Ex?"""#password;"""
password?=?XXX
cert_file?=
key_file?=
skip_verify?=?true
[email protected]
from_name?=?Grafana
ehlo_identity?=?ininin.com
然后需要重啟Grafana,命令grafana-server.exe -config=E:\file\grafana-6.3.3\conf\custom.ini
第三步: 為指標(biāo)添加alert
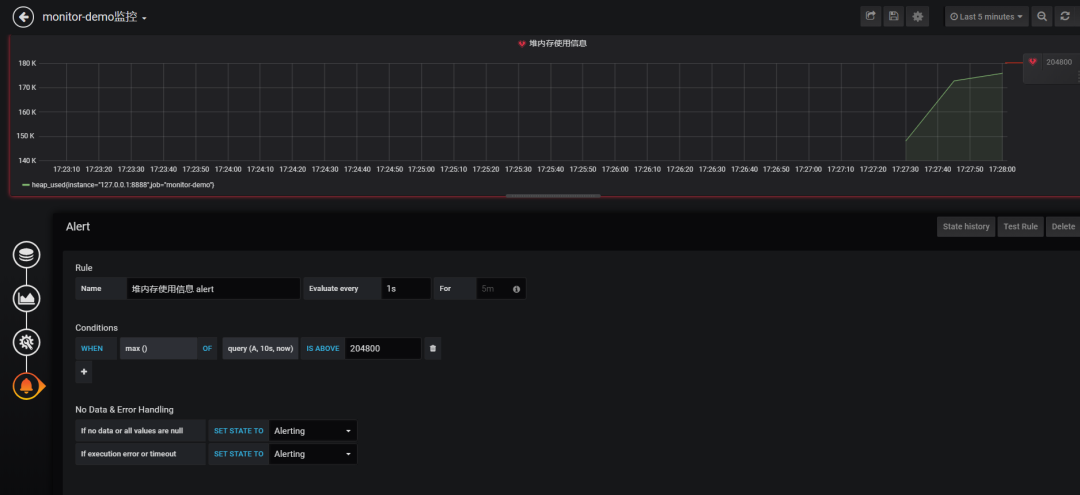
配置預(yù)警規(guī)則
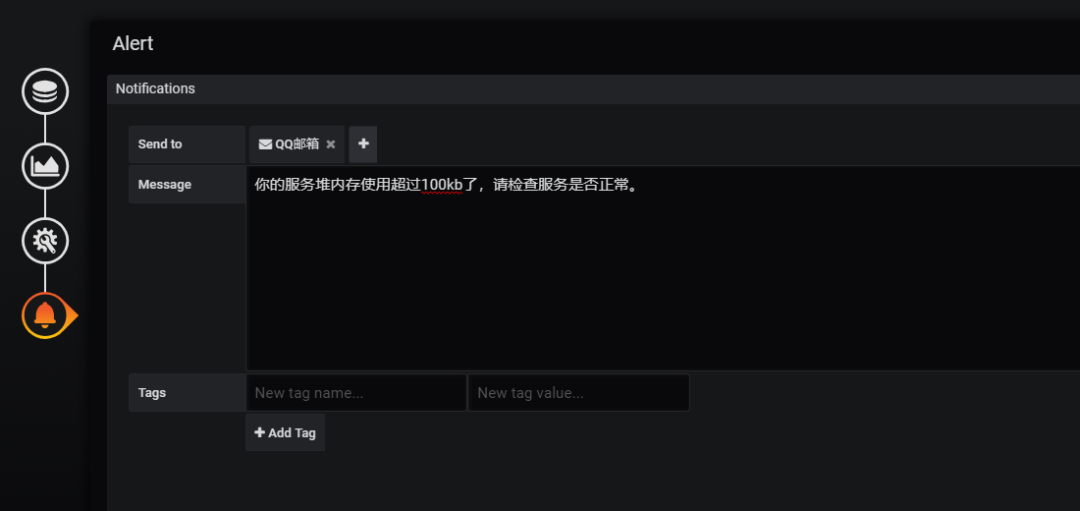
配置通知方式和信息
Evaluate every
表示檢測評率,這里為了測試效果,改為1秒
For
如果警報規(guī)則配置了For,并且查詢違反了配置的閾值,那么它將首先從OK變?yōu)镻ending。從OK到Pending Grafana不會發(fā)送任何通知。一旦警報規(guī)則的觸發(fā)時間超過持續(xù)時間,它將更改為Alerting并發(fā)送警報通知。
Conditions
when 表示什么時間,of 表示條件,is above 表示觸發(fā)值 同時,設(shè)置了is above后會有一條紅線。
If no data or all values are null
如果沒有數(shù)據(jù)或所有值都為空,這里選擇觸發(fā)報警
If execution error or timeout
如果執(zhí)行錯誤或超時,這里選擇觸發(fā)報警
注意: 下一次觸發(fā),比如10秒后,它不會再次觸發(fā),防止報警風(fēng)暴產(chǎn)生!
第四步: 測試
請求http://localhost:8848/heap/test接口后,內(nèi)存升高大于設(shè)置的閾值,然后就收到報警郵件。
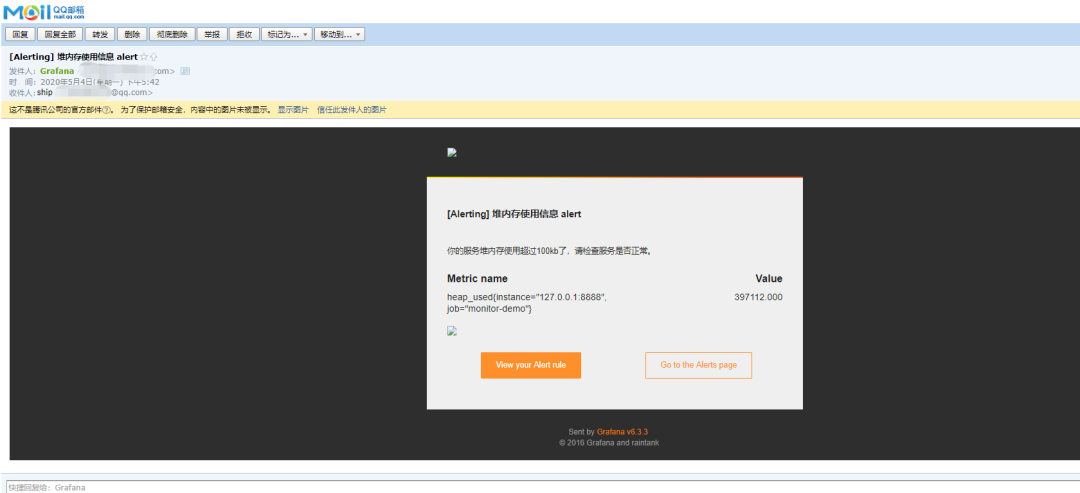
報警郵件
這里圖片沒有顯示出來,搞不懂為什么。
六、總結(jié)
這套監(jiān)控功能還是挺強大的,就是Prometheus的表達式有點多。
附上幾個鏈接:
Prometheus官方文檔 : https://prometheus.io/docs/introduction/first_steps/ Grafana官方文檔: https://grafana.com/docs/grafana/latest/ 代碼地址: https://github.com/2YSP/monitor-demo
最近面試BAT,整理一份面試資料《Java面試BATJ通關(guān)手冊》,覆蓋了Java核心技術(shù)、JVM、Java并發(fā)、SSM、微服務(wù)、數(shù)據(jù)庫、數(shù)據(jù)結(jié)構(gòu)等等。
獲取方式:點“在看”,關(guān)注公眾號并回復(fù)?Java?領(lǐng)取,更多內(nèi)容陸續(xù)奉上。
PS:因公眾號平臺更改了推送規(guī)則,如果不想錯過內(nèi)容,記得讀完點一下“在看”,加個“星標(biāo)”,這樣每次新文章推送才會第一時間出現(xiàn)在你的訂閱列表里。
點“在看”支持小哈呀,謝謝啦??
