
在 Cocos Creator 里畫個炫酷的雷達(dá)圖(附源碼)
前言
??雷達(dá)圖(Radar Chart) 也稱為網(wǎng)絡(luò)圖、星圖或蜘蛛網(wǎng)圖。
是以從同一點(diǎn)開始的軸上表示的三個或更多個定量變量的二維圖表的形式顯示多元數(shù)據(jù)的圖形方法。
適用于顯示三個或更多的維度的變量。
??雷達(dá)圖常用于?數(shù)據(jù)統(tǒng)計(jì)或?qū)Ρ龋瑢τ诓榭茨男┳兞烤哂邢嗨频闹怠⒆兞恐g是否有異常值都很有用。
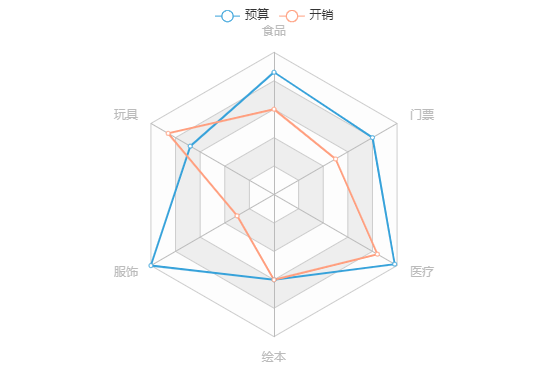
?同時在不少游戲中都有雷達(dá)圖的身影,可以很直觀地展示并對比一些數(shù)據(jù)。
例如王者榮耀中的對戰(zhàn)資料中就用到了:

?那么在本篇文章中,皮皮就來分享下在 Cocos Creator 中如何利用 Graphics 組件來繪制炫酷的雷達(dá)圖~
文中會對原始代碼進(jìn)行一定的削減以保證閱讀體驗(yàn)。
需要完整代碼文件的小伙伴可在文章底部“閱讀原文”處獲取。
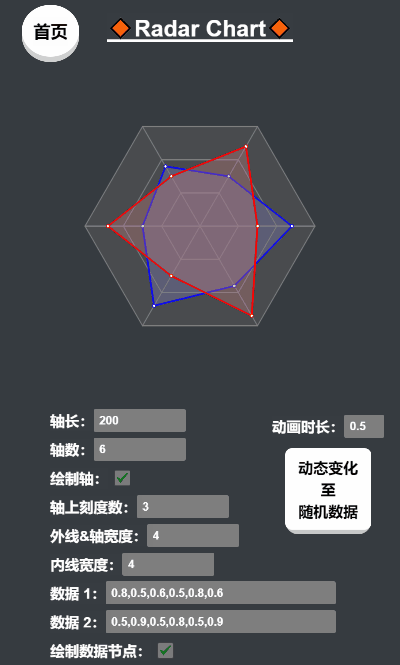
預(yù)覽
?先來看看效果吧~
在線預(yù)覽:https://ifaswind.gitee.io/eazax-cases/?case=radarChart
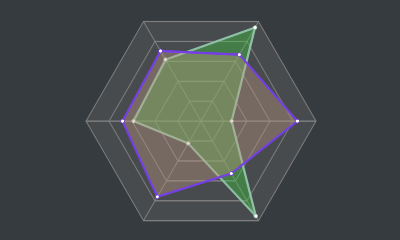
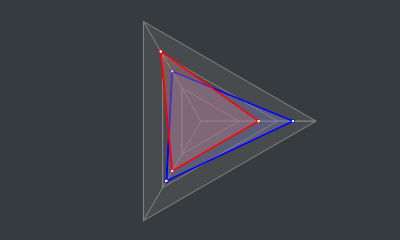
?「兩條數(shù)據(jù)」
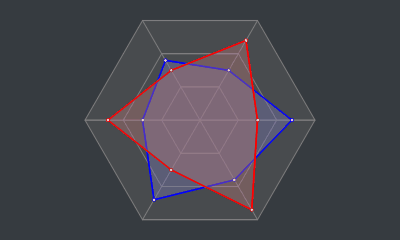
?「緩動數(shù)據(jù)」
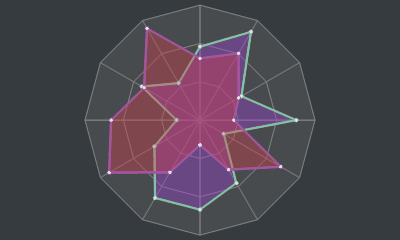
?「花里胡哨」

?「藝術(shù)就是爆炸」

?「逐漸偏離主題」
? 沒有人
? 比我
? 更懂
?? 花里胡哨
(?川老師直呼內(nèi)行)
正文
?Graphics 組件
在我們正式開始制作雷達(dá)圖之前,讓我們先來大概了解一下 Cocos Creator 引擎中的 Graphics 組件。
Graphics 組件繼承于 cc.RenderComponent,利用該組件我們可以實(shí)現(xiàn)畫板和表格之類的功能。
屬性(Properties)
下面是我們本次將會用到的屬性:
lineCap:設(shè)置或返回線條兩端的樣式(無、圓形線帽或方形線帽)lineJoin:設(shè)置或返回兩條線相交時的拐角樣式(斜角、圓角或尖角)lineWidth:設(shè)置或返回當(dāng)前畫筆的粗細(xì)(線條的寬度)strokeColor:設(shè)置或返回當(dāng)前畫筆的顏色fillColor:設(shè)置或返回填充用的顏色(油漆桶)
函數(shù)(Functions)
下面是我們本次將會用到的函數(shù):
moveTo(x, y):抬起畫筆并移動到指定位置(不創(chuàng)建線條)lineTo(x, y):放下畫筆并創(chuàng)建一條直線至指定位置circle(cx, cy, r):在指定位置(圓心)畫一個圓close():閉合已創(chuàng)建的線條(相當(dāng)于lineTo(起點(diǎn)))stroke():繪制已創(chuàng)建(但未被繪制)的線條(將線條想象成默認(rèn)透明的,此行為則是賦予線條顏色)fill():填充當(dāng)前線條包圍的區(qū)域(如果線條沒有閉合則會嘗試”模擬閉合“起點(diǎn)和終點(diǎn))clear():擦掉當(dāng)前畫板上的所有東西
Graphics 組件文檔:http://docs.cocos.com/creator/manual/zh/components/graphics.html?h=graphics
?畫網(wǎng)格
捋一捋
先來看看一個標(biāo)準(zhǔn)的雷達(dá)圖有啥特點(diǎn):
?發(fā)現(xiàn)了嗎?雷達(dá)圖的基本特點(diǎn)如下:
有 3 條或以上的軸線 軸與軸之間的夾角相同 每條軸上除中心點(diǎn)外應(yīng)至少有 1 個刻度 每條軸上都有相同的刻度 刻度與刻度之間的距離也相同 軸之間的刻度相連形成網(wǎng)格線
動手吧
計(jì)算軸線角度
先算出軸之間的夾角度數(shù) [ 360 ÷ 軸數(shù) ],再計(jì)算所有軸的角度:
this.angles?=?[];
//?軸間夾角
const?iAngle?=?360?/?this.axes;
for?(let?i?=?0;?i?this.axes;?i++)?{
????//?計(jì)算
????const?angle?=?iAngle?*?i;
????this.angles.push(angle);
}
計(jì)算刻度坐標(biāo)
雷達(dá)圖至少擁有 3 條軸,且「每條軸上都應(yīng)有 1 個或以上的刻度(不包含中心點(diǎn))」:

所以我們需使用一個二維數(shù)組來保存所有刻度的坐標(biāo),從最外層(即軸線的末端)的刻度開始記錄,方便我們繪制時讀取:
//?創(chuàng)建一個二維數(shù)組
let?scalesSet:?cc.Vec2[][]?=?[];
for?(let?i?=?0;?i?????//?用來保存當(dāng)前層上的刻度坐標(biāo)
????let?scales?=?[];
????//?計(jì)算刻度在軸上的位置
????const?length?=?軸線長度?-?(軸線長度?/?軸上刻度個數(shù)?*?i);
????for?(let?j?=?0;?j?this.angles.length;?j++)?{
????????//?將角度轉(zhuǎn)為弧度
????????const?radian?=?(Math.PI?/?180)?*?this.angles[j];
????????//?根據(jù)三角公式計(jì)算刻度相對于中心點(diǎn)(0,?0)的坐標(biāo)
????????const?pos?=?cc.v2(length?*?Math.cos(radian),?length?*?Math.sin(radian));
????????//?推進(jìn)數(shù)組
????????scales.push(pos);
????}
????//?推進(jìn)二維數(shù)組
????scalesSet.push(scales);
}
繪制軸線和外網(wǎng)格線
軸線
連接中心點(diǎn) (0, 0) 和最外層 scalesSet[0] 的刻度即為軸線:
//?遍歷全部最外層的刻度
for?(let?i?=?0;?i?0].length;?i++)?{
????//?畫筆移動至中心點(diǎn)
????this.graphics.moveTo(0,?0);
????//?創(chuàng)建線條
????this.graphics.lineTo(scalesSet[0][i].x,?scalesSet[0][i].y);
}
外網(wǎng)格線
連接所有軸上最外層 scalesSet[0] 的刻度即形成外網(wǎng)格線:
//?畫筆移動至第一個點(diǎn)
this.graphics.moveTo(scalesSet[0][0].x,?scalesSet[0][0].y);
for?(let?i?=?1;?i?0].length;?i++)?{
????//?創(chuàng)建線條
????this.graphics.lineTo(scalesSet[0][i].x,?scalesSet[0][i].y);
}
//?閉合當(dāng)前線條(外網(wǎng)格線)
this.graphics.close();
填充并繪制
這里需要注意「先填充顏色再繪制線條」,要不然軸線和網(wǎng)格線就被擋住了:
//?填充線條包圍的空白區(qū)域
this.graphics.fill();
//?繪制已創(chuàng)建的線條(軸線和外網(wǎng)格線)
this.graphics.stroke();
?于是現(xiàn)在我們就有了這么個玩意兒:

繪制內(nèi)網(wǎng)格線
當(dāng)刻度大于 1 個時就需要繪制內(nèi)網(wǎng)格線,從刻度坐標(biāo)集的下標(biāo) 1 開始繪制:
//?刻度大于?1?個時才繪制內(nèi)網(wǎng)格線
if?(scalesSet.length?>?1)?{
????//?從下邊 1 開始(下標(biāo)?0?是外網(wǎng)格線)
????for?(let?i?=?1;?i?????????//?畫筆移動至第一個點(diǎn)
????????this.graphics.moveTo(scalesSet[i][0].x,?scalesSet[i][0].y);
????????for?(let?j?=?1;?j?????????????//?創(chuàng)建線條
????????????this.graphics.lineTo(scalesSet[i][j].x,?scalesSet[i][j].y);
????????}
????????//?閉合當(dāng)前線條(內(nèi)網(wǎng)格線)
????????this.graphics.close();
????}
????//?繪制已創(chuàng)建的線條(內(nèi)網(wǎng)格線)
????this.graphics.stroke();
}
?就這樣我們雷達(dá)圖的底子就畫好啦:

?畫數(shù)據(jù)
捋一捋
編寫畫線邏輯之前,先確定一下我們需要的數(shù)據(jù)結(jié)構(gòu):
數(shù)值數(shù)組(必須,小數(shù)形式的比例,至少包含 3 個值) 線的寬度(可選,不指定則使用默認(rèn)值) 線的顏色(可選,不指定則使用默認(rèn)值) 填充的顏色(可選,不指定則使用默認(rèn)值) 節(jié)點(diǎn)的顏色(可選,不指定則使用默認(rèn)值)
具體的數(shù)據(jù)結(jié)構(gòu)如下(導(dǎo)出類型方便外部使用):
/**
?*?雷達(dá)圖數(shù)據(jù)
?*/
export?interface?RadarChartData?{

????/**?數(shù)值?*/
????values:?number[];

????/**?線的寬度?*/
????lineWidth?:?number;

????/**?線的顏色?*/
????lineColor?:?cc.Color;

????/**?填充的顏色?*/
????fillColor?:?cc.Color;

????/**?節(jié)點(diǎn)的顏色?*/
????joinColor?:?cc.Color;

}
動手吧
繪制數(shù)據(jù)比較簡單,我們只需要算出數(shù)據(jù)點(diǎn)在圖表中的位置,并將數(shù)據(jù)連起來就好了。
在 draw 函數(shù)中我們接收一份或以上的雷達(dá)圖數(shù)據(jù),并按照順序遍歷繪制出來(??長代碼警告):
/**
?*?繪制數(shù)據(jù)
?*?@param?data?數(shù)據(jù)
?*/
public?draw(data:?RadarChartData?|?RadarChartData[])?{
????//?處理數(shù)據(jù)
????const?datas?=?Array.isArray(data)???data?:?[data];

????//?開始繪制數(shù)據(jù)
????for?(let?i?=?0;?i?????????//?裝填染料
????????this.graphics.strokeColor?=?datas[i].lineColor?||?defaultOptions.lineColor;
????????this.graphics.fillColor?=?datas[i].fillColor?||?defaultOptions.fillColor;
????????this.graphics.lineWidth?=?datas[i].lineWidth?||?defaultOptions.lineWidth;

????????//?計(jì)算節(jié)點(diǎn)坐標(biāo)
????????let?coords?=?[];
????????for?(let?j?=?0;?j?this.axes;?j++)?{
????????????const?value?=?datas[i].values[j]?>?1???1?:?datas[i].values[j];
????????????const?length?=?value?*?this.axisLength;
????????????const?radian?=?(Math.PI?/?180)?*?this.angles[j];
????????????const?pos?=?cc.v2(length?*?Math.cos(radian),?length?*?Math.sin(radian))
????????????coords.push(pos);
????????}

????????//?創(chuàng)建線條
????????this.graphics.moveTo(coords[0].x,?coords[0].y);
????????for?(let?j?=?1;?j?????????????this.graphics.lineTo(coords[j].x,?coords[j].y);
????????}
????????this.graphics.close();?//?閉合線條
????????
????????//?填充包圍區(qū)域
????????this.graphics.fill();
????????//?繪制線條
????????this.graphics.stroke();

????????//?繪制數(shù)據(jù)節(jié)點(diǎn)
????????for?(let?j?=?0;?j?????????????//?大圓
????????????this.graphics.strokeColor?=?datas[i].lineColor?||?defaultOptions.lineColor;
????????????this.graphics.circle(coords[j].x,?coords[j].y,?2);
????????????this.graphics.stroke();
????????????//?小圓
????????????this.graphics.strokeColor?=?datas[i].joinColor?||?defaultOptions.joinColor;
????????????this.graphics.circle(coords[j].x,?coords[j].y,?.65);
????????????this.graphics.stroke();
????????}

????}
}
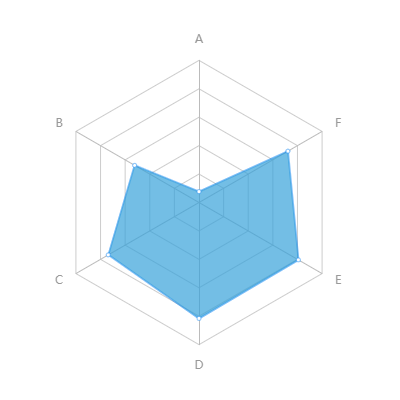
?到這里我們已經(jīng)成功制作了一個可用的雷達(dá)圖:
?「但是!我們的征途是星辰大海!必須加點(diǎn)料!」
?加料不加價(jià)
動起來?
?完全靜態(tài)的雷達(dá)圖實(shí)在是太無趣太普通,得想想辦法讓它動起來!
?我們的雷達(dá)圖數(shù)據(jù)的數(shù)值是數(shù)組形式,想到怎么樣才能讓這些數(shù)值動起來了嗎?
?「別 擔(dān) 心 !」
?得益于 Cocos Creator 為我們提供的 「Tween 緩動系統(tǒng)」,讓復(fù)雜的數(shù)據(jù)動起來變得異常簡單!
?我們只需要這樣,這樣,然后那樣,是不是很簡單?
cc.tween支持緩動任意對象的任意屬性緩動系統(tǒng):http://docs.cocos.com/creator/manual/zh/scripting/tween.html
另外我在《一個全能的挖孔 Shader》中也是使用了緩動系統(tǒng)來讓挖孔動起來~
在線預(yù)覽:https://ifaswind.gitee.io/eazax-cases/?case=newGuide
動手吧
我的思路是:
將當(dāng)前的數(shù)據(jù)保存到當(dāng)前實(shí)例的 this.curDatas中接收到新的數(shù)據(jù)時,使用 cc.tween對this.curData的屬性進(jìn)行緩動在 update中調(diào)用draw函數(shù),每幀都重新繪制this.curDatas中的數(shù)據(jù)
每幀更新
//?當(dāng)前雷達(dá)圖數(shù)據(jù)
private?curDatas:?RadarChartData[]?=?[];

protected?update()?{
????if?(!this.keepUpdating)?return;
????//?繪制當(dāng)前數(shù)據(jù)
????this.draw(this.curDatas);
}
緩動數(shù)據(jù)
/**
?*?緩動繪制
?*?@param?data?目標(biāo)數(shù)據(jù)
?*?@param?duration?動畫時長
?*/
public?to(data:?RadarChartData?|?RadarChartData[],?duration:?number)?{
????//?處理重復(fù)調(diào)用
????this.unscheduleAllCallbacks();
????
????//?包裝單條數(shù)據(jù)
????const?datas?=?Array.isArray(data)???data?:?[data];

????//?打開每幀更新
????this.keepUpdating?=?true;

????//?動起來!
????for?(let?i?=?0;?i?????????//?數(shù)值動起來!
????????//?遍歷數(shù)據(jù)中的全部數(shù)值,逐個讓他們動起來!
????????for?(let?j?=?0;?j?this.curDatas[i].values.length;?j++)?{
????????????//?限制最大值為?1(即?100%)
????????????const?value?=?datas[i].values[j]?>?1???1?:?datas[i].values[j];
????????????cc.tween(this.curDatas[i].values)
????????????????.to(duration,?{?[j]:?value?})
????????????????.start();
????????}
????????//?樣式動起來!
????????//?沒有指定則使用原來的樣式!
????????cc.tween(this.curDatas[i])
????????????.to(duration,?{
????????????????lineWidth:?datas[i].lineWidth?||?this.curDatas[i].lineWidth,
????????????????lineColor:?datas[i].lineColor?||?this.curDatas[i].lineColor,
????????????????fillColor:?datas[i].fillColor?||?this.curDatas[i].fillColor,
????????????????joinColor:?datas[i].joinColor?||?this.curDatas[i].joinColor
????????????})
????????????.start();
????}

????this.scheduleOnce(()?=>?{
????????//?關(guān)閉每幀更新
????????this.keepUpdating?=?false;
????},?duration);
}
計(jì)劃通
?數(shù)值和樣式都動起來了:
源碼倉庫:https://gitee.com/ifaswind/eazax-ccc/blob/master/components/RadarChart.ts
點(diǎn)擊文章底部“閱讀原文”即可獲取完整雷達(dá)圖組件。