
使用 LIME 和 SHAP 更好地解釋機器學習模型的預測
↓推薦關注↓
模型
我們將使用來自 Kaggle 的糖尿病數(shù)據(jù)集。主要關注點是可解釋性,因此我們不會花太多時間嘗試擁有花哨的模型。
# Load useful libraries
import pandas as pd
from sklearn.model_selection import train_test_split
from sklearn.ensemble import RandomForestClassifier
from sklearn.model_selection import cross_val_score
`
# Read data set
df = pd.read_csv("./data/diabetes.csv")

# Separate Features and Target Variables
X = df.drop(columns='Outcome')
y = df['Outcome']

# Create Train & Test Data
X_train, X_test, y_train, y_test = train_test_split(
              X, y,test_size=0.3,
              stratify =y,
              random_state = 13)

# Build the model
rf_clf = RandomForestClassifier(max_features=2, n_estimators =100 ,bootstrap = True)

# Make prediction on the testing data
y_pred = rf_clf.predict(X_test)

# Classification Report
print(classification_report(y_pred, y_test))
rf_clf.fit(X_train, y_train)
SHAP
它是 SHapley Additive exPlanations的縮寫。該方法旨在通過計算每個特征對預測的貢獻來解釋實例/觀察的預測。
# Import the SHAP library
import shap

# load JS visualization code to notebook
shap.initjs()

# Create the explainer
explainer = TreeExplainer(rf_clf)

"""
Compute shap_values for all of X_test rather instead of
a single row, to have more data for plot.
"""
shap_values = explainer.shap_values(X_test)

print("Variable Importance Plot - Global Interpretation")
figure = plt.figure()
shap.summary_plot(shap_values, X_test)
SHAP有許多用于模型解釋的可視化圖表,但我們將著重介紹其中的幾個。
特征重要性的匯總圖
print("Variable Importance Plot - Global Interpretation")
figure = plt.figure()
shap.summary_plot(shap_values, X_test)
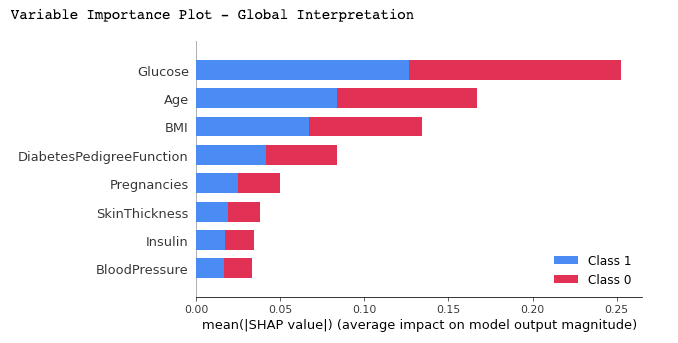
我們可以從上面的圖中得到以下的結論:
它顯示了重要特征的列表,從最重要到最不重要(從上到下)。 所有特征似乎對診斷為糖尿病(標簽 = 1)或未診斷(標簽 = 0)的兩個類別的貢獻均等,因為基本上都占據(jù)了矩形的 50%。 根據(jù)該模型,Glucose(葡萄糖)是對預測貢獻最大的特征。Age(年齡)是貢獻第二大的特征 Pregnancies(懷孕)是預測能力最強的第 5 個特征。
特定分類結果的匯總圖
# Summary Plot Deep-Dive on Label 1
shap.summary_plot(shap_values[1], X_test)
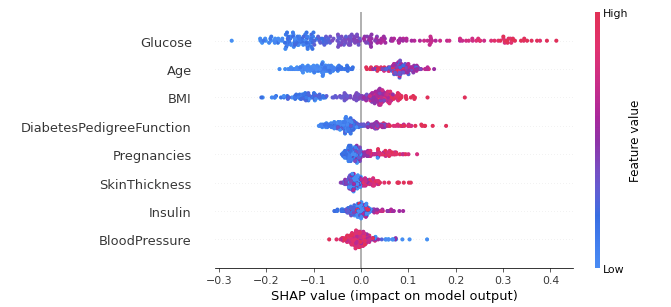
對于分類問題,每個標簽都有 SHAP 值。在我們的例子中,我們使用 1 (True) 的預測顯示該類結果的匯總。該圖的表示內容如下:
特征的重要性和排序與匯總圖一樣,排名越上,重要性越高。 圖中每個點代表單個數(shù)據(jù)實例的特征值。 顏色表明該特征是高值(紅色)還是低值(藍色)。 X 軸代表對預測輸出的正或負貢獻
當我們將這些分析應用于特征時,我們得到以下結論:
對于葡萄糖:我們看到大多數(shù)高值(紅點)對預測輸出有正貢獻(在 X 軸上為正)。換句話說,如果單個數(shù)據(jù)實例的葡萄糖量很高,則其獲得1結果(被診斷患有糖尿病)的機會會大大增加,而低量(藍點)會降低(負 X 軸值)被診斷為糖尿病的概率。
對于年齡:對年齡進行相同的分析。年齡越高,數(shù)據(jù)實例(患者)最有可能被診斷出患有糖尿病。
另一方面,模型在涉及未成年人時似乎很混亂,因為我們可以在垂直線(X 軸 = 0)的每一側觀察到幾乎相同數(shù)量的數(shù)據(jù)點。由于年齡特征對分析來說似乎令人困惑,我們可以使用下面的相關圖來獲得更細粒度的信息。
相關圖(依賴圖)
# Dependence Plot on Age feature
shap.dependence_plot('Age', shap_values[1], X_test, interaction_index="Age")

從相關圖中我們可以清楚地看到,30歲以下的患者被診斷為糖尿病的風險較低,而30歲以上的患者被診斷為糖尿病的風險較高。
LIME
它是 Local Interpretable Model Agnostic Explanation的縮寫。局部(Local )意味著它可以用于解釋機器學習模型的個別預測。
要使用它也非常的簡單,只需要2個步驟:(1) 導入模塊,(2) 使用訓練值、特征和目標擬合解釋器。
# Import the LimeTabularExplainer module
from lime.lime_tabular import LimeTabularExplainer

# Get the class names
class_names = ['Has diabetes', 'No diabetes']

# Get the feature names
feature_names = list(X_train.columns)

# Fit the Explainer on the training data set using the LimeTabularExplainer
explainer = LimeTabularExplainer(X_train.values, feature_names = feature_names,
                                 class_names = class_names, mode = 'classification')
代碼中我們使用class_names創(chuàng)建了兩個標簽,而不是 1 和 0因為使用名字會更加的直觀。
對單例進行解釋說明
這里的解釋是針對測試數(shù)據(jù)中的單個實例進行的
#Perform the explanation on the 8th instance in the test data
explaination = explainer.explain_instance(X_test.iloc[8], rf_clf.predict_proba)

# show the result of the model's explaination
explaination.show_in_notebook(show_table = True, show_all = False)
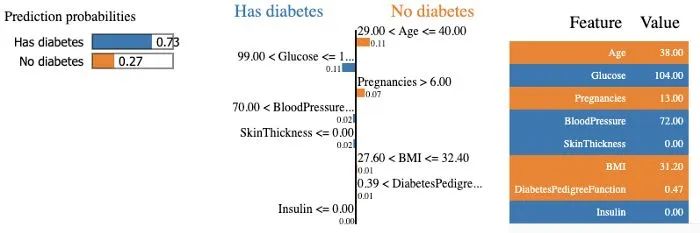
該模型以 73% 的置信度預測該特定患者患有糖尿病,并解釋該預測,因為血糖水平高于 99,血壓高于 70。在右側,我們可以看到患者特征的值。
總結
本文中接單的介紹了如何使用 SHAP 和 LIME 解釋您的機器學習模型。現(xiàn)在,你也可以對構建的模型進行可解釋性分析了,這可以幫助決策者和其他利益相關者獲得更多的可見性并理解導致模型輸出的決策的解釋。,你可以在下面的資源中找到本文包含的兩個python包,閱讀他們的文檔可以找到更加高級的使用方式。
參考資料
https://shap.readthedocs.io/en/latest/index.html
https://lime-ml.readthedocs.io/en/latest/
kaggle數(shù)據(jù)集:https://www.kaggle.com/cjboat/diabetes2
長按或掃描下方二維碼,后臺回復:加群,即可申請入群。一定要備注:來源+研究方向+學校/公司,否則不拉入群中,見諒!
(長按三秒,進入后臺)
推薦閱讀
