
制作大全!Python動(dòng)態(tài)圖表
關(guān)于動(dòng)態(tài)圖表,相信大家都或多或少的接觸過(guò)一些,如果是代碼水平比較不錯(cuò)的,可以選擇 Matplotlib,當(dāng)然也可以使用 pyecharts 的相關(guān)功能,不過(guò)這些工具都專注于圖表的制作,也就是對(duì)于圖表的數(shù)據(jù),你是需要自行轉(zhuǎn)換的。而今天介紹的這個(gè)可視化圖庫(kù),完美的結(jié)合了 Pandas 數(shù)據(jù)格式,又輔以 Matplotlib 的強(qiáng)大功能,使得我們制作動(dòng)圖變得容易的多了。
圖庫(kù)簡(jiǎn)介
這款給力的可視化圖庫(kù),就是 pandas_alive,雖然當(dāng)前在 GitHub 上的 star 數(shù)量不是很高,但是相信憑借其強(qiáng)大的功能,嶄露頭角也是遲早的事情
項(xiàng)目地址:
https://github.com/JackMcKew/pandas_alive
項(xiàng)目安裝:
與一般的 Python 庫(kù)一樣,直接使用 pip 安裝即可,這里有一點(diǎn)需要注意,就是由于是通過(guò) Matplotlib 來(lái)制作動(dòng)圖,所以需要手動(dòng)安裝下 Matplotlib 的依賴工具 imagemagick,這是一個(gè)圖片處理工具,感興趣的同學(xué)可以自行查看下
項(xiàng)目功能:
這款可視化圖庫(kù),可以支持的圖表類(lèi)型是非常多的,包括動(dòng)態(tài)條形圖、動(dòng)態(tài)曲線圖、氣泡圖、餅狀圖以及地圖等等,這些圖表差不多可以滿足我們?nèi)粘5氖褂昧?/p>
制圖簡(jiǎn)介
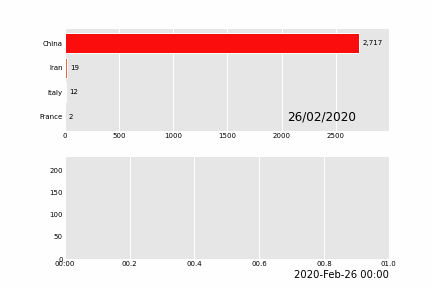
這里我們就來(lái)簡(jiǎn)單看一下該如何制作動(dòng)態(tài)圖表吧,首先是動(dòng)態(tài)條形圖,基本4行代碼搞定,有兩行還是 import
import?pandas_alive
import?pandas?as?pd

covid_df?=?pd.read_csv('covid19.csv',?index_col=0,?parse_dates=[0])

covid_df.diff().fillna(0).plot_animated(filename='line_chart.gif',kind='line',period_label={'x':0.25,'y':0.9})
怎么樣,是不是超級(jí)方便呢
下面我們就來(lái)看看其他圖表的制作方法吧!
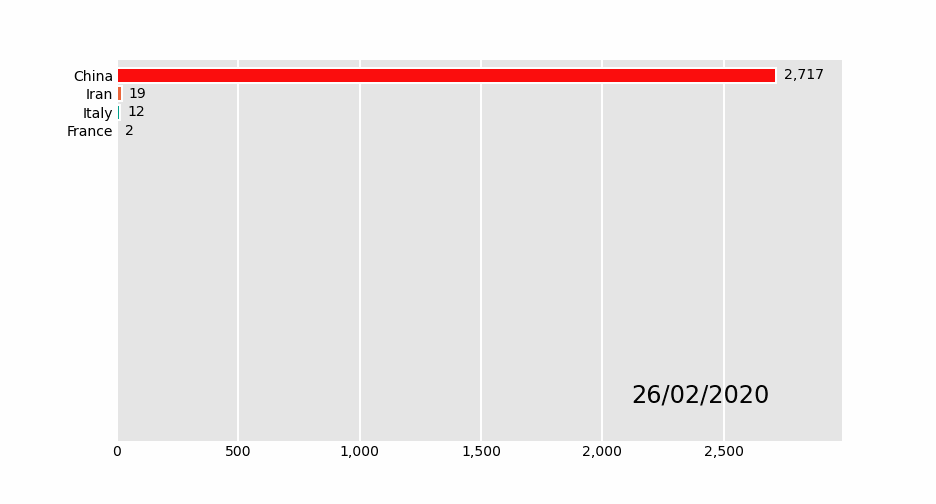
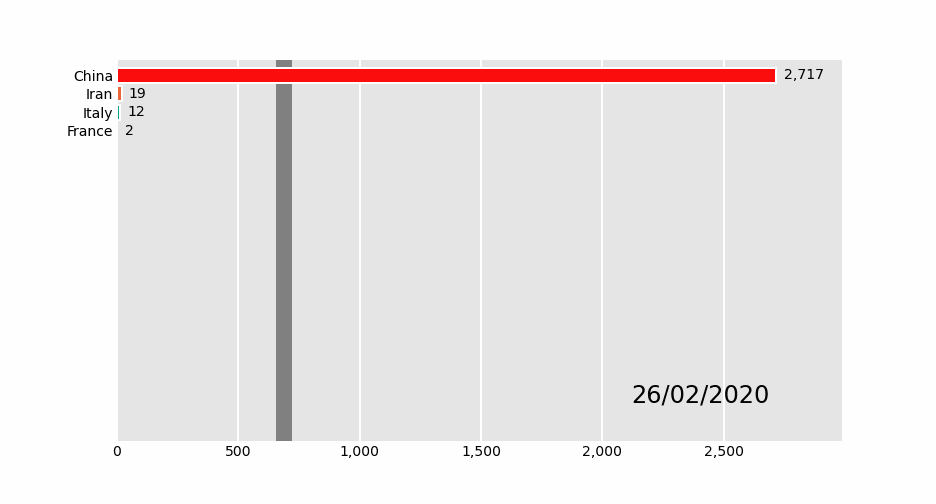
01 動(dòng)態(tài)條形圖
import?pandas_alive
import?pandas?as?pd

covid_df?=?pd.read_csv('covid19.csv',?index_col=0,?parse_dates=[0])

covid_df.plot_animated(filename='examples/perpendicular-example.gif',perpendicular_bar_func='mean')
02 動(dòng)態(tài)柱狀圖
import?pandas_alive

import?pandas?as?pd

covid_df?=?pd.read_csv('covid19.csv',?index_col=0,?parse_dates=[0])

covid_df.plot_animated(filename='examples/example-barv-chart.gif',orientation='v')

03 動(dòng)態(tài)曲線圖
import?pandas_alive

import?pandas?as?pd

covid_df?=?pd.read_csv('covid19.csv',?index_col=0,?parse_dates=[0])

covid_df.diff().fillna(0).plot_animated(filename='examples/example-line-chart.gif',kind='line',period_label={'x':0.25,'y':0.9})

04 動(dòng)態(tài)面積圖
import?pandas_alive

import?pandas?as?pd

covid_df?=?pd.read_csv('covid19.csv',?index_col=0,?parse_dates=[0])

covid_df.sum(axis=1).fillna(0).plot_animated(filename='examples/example-bar-chart.gif',kind='bar',
????????period_label={'x':0.1,'y':0.9},
????????enable_progress_bar=True,?steps_per_period=2,?interpolate_period=True,?period_length=200
)
05 動(dòng)態(tài)散點(diǎn)圖
import?pandas?as?pd
import?pandas_alive

max_temp_df?=?pd.read_csv(
????"data/Newcastle_Australia_Max_Temps.csv",
????parse_dates={"Timestamp":?["Year",?"Month",?"Day"]},
)
min_temp_df?=?pd.read_csv(
????"data/Newcastle_Australia_Min_Temps.csv",
????parse_dates={"Timestamp":?["Year",?"Month",?"Day"]},
)

merged_temp_df?=?pd.merge_asof(max_temp_df,?min_temp_df,?on="Timestamp")

merged_temp_df.index?=?pd.to_datetime(merged_temp_df["Timestamp"].dt.strftime('%Y/%m/%d'))

keep_columns?=?["Minimum?temperature?(Degree?C)",?"Maximum?temperature?(Degree?C)"]

merged_temp_df[keep_columns].resample("Y").mean().plot_animated(filename='examples/example-scatter-chart.gif',kind="scatter",title='Max?&?Min?Temperature?Newcastle,?Australia')
06 動(dòng)態(tài)餅圖
import?pandas_alive

import?pandas?as?pd

covid_df?=?pd.read_csv('covid19.csv',?index_col=0,?parse_dates=[0])

covid_df.plot_animated(filename='examples/example-pie-chart.gif',kind="pie",rotatelabels=True,period_label={'x':0,'y':0})

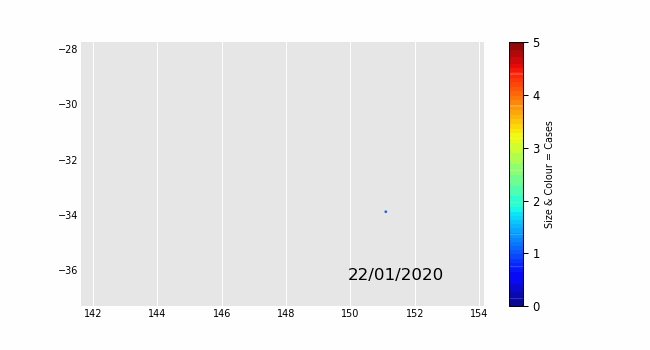
07 動(dòng)態(tài)氣泡圖
import?pandas_alive

multi_index_df?=?pd.read_csv("data/multi.csv",?header=[0,?1],?index_col=0)

multi_index_df.index?=?pd.to_datetime(multi_index_df.index,dayfirst=True)

map_chart?=?multi_index_df.plot_animated(
????kind="bubble",
????filename="examples/example-bubble-chart.gif",
????x_data_label="Longitude",
????y_data_label="Latitude",
????size_data_label="Cases",
????color_data_label="Cases",
????vmax=5,?steps_per_period=3,?interpolate_period=True,?period_length=500,
????dpi=100
)
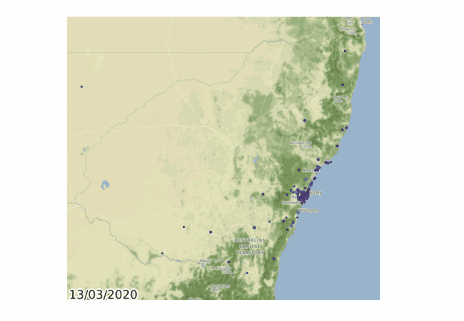
08 動(dòng)態(tài)地理圖表
import?geopandas
import?pandas_alive
import?contextily

gdf?=?geopandas.read_file('data/nsw-covid19-cases-by-postcode.gpkg')
gdf.index?=?gdf.postcode
gdf?=?gdf.drop('postcode',axis=1)

map_chart?=?gdf.plot_animated(filename='examples/example-geo-point-chart.gif',basemap_format={'source':contextily.providers.Stamen.Terrain})
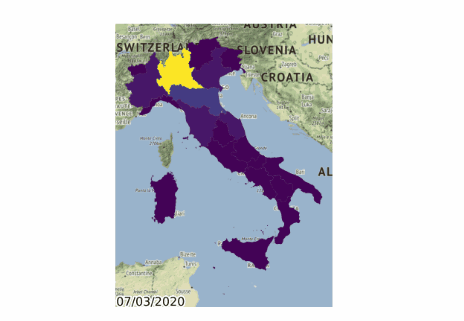
09 行政區(qū)域動(dòng)圖
import?geopandas
import?pandas_alive
import?contextily

gdf?=?geopandas.read_file('data/italy-covid-region.gpkg')
gdf.index?=?gdf.region
gdf?=?gdf.drop('region',axis=1)

map_chart?=?gdf.plot_animated(filename='examples/example-geo-polygon-chart.gif',basemap_format={'source':contextily.providers.Stamen.Terrain})
10 多動(dòng)圖組合
import?pandas_alive

import?pandas?as?pd

covid_df?=?pd.read_csv('covid19.csv',?index_col=0,?parse_dates=[0])

animated_line_chart?=?covid_df.diff().fillna(0).plot_animated(kind='line',period_label=False,add_legend=False)

animated_bar_chart?=?covid_df.plot_animated(n_visible=10)

pandas_alive.animate_multiple_plots('examples/example-bar-and-line-chart.gif',[animated_bar_chart,animated_line_chart],
????enable_progress_bar=True)
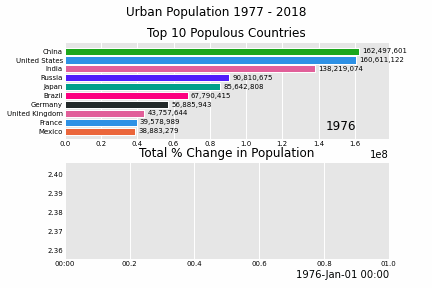
11 城市人口變化
import?pandas_alive

urban_df?=?pandas_alive.load_dataset("urban_pop")

animated_line_chart?=?(
????urban_df.sum(axis=1)
????.pct_change()
????.fillna(method='bfill')
????.mul(100)
????.plot_animated(kind="line",?title="Total?%?Change?in?Population",period_label=False,add_legend=False)
)

animated_bar_chart?=?urban_df.plot_animated(n_visible=10,title='Top?10?Populous?Countries',period_fmt="%Y")

pandas_alive.animate_multiple_plots('examples/example-bar-and-line-urban-chart.gif',[animated_bar_chart,animated_line_chart],
????title='Urban?Population?1977?-?2018',?adjust_subplot_top=0.85,?enable_progress_bar=True)
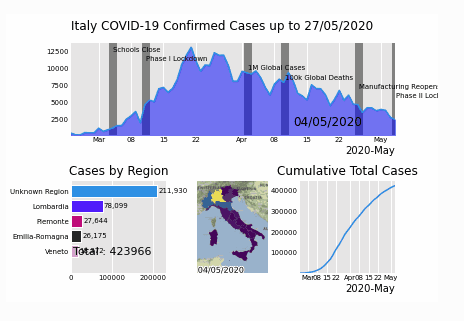
12 意大利疫情
import?geopandas
import?pandas?as?pd
import?pandas_alive
import?contextily
import?matplotlib.pyplot?as?plt


region_gdf?=?geopandas.read_file('data\geo-data\italy-with-regions')
region_gdf.NOME_REG?=?region_gdf.NOME_REG.str.lower().str.title()
region_gdf?=?region_gdf.replace('Trentino-Alto?Adige/Sudtirol','Trentino-Alto?Adige')
region_gdf?=?region_gdf.replace("Valle?D'Aosta/Vall??e?D'Aoste\r\nValle?D'Aosta/Vall??e?D'Aoste","Valle?d'Aosta")

italy_df?=?pd.read_csv('data\Regional?Data?-?Sheet1.csv',index_col=0,header=1,parse_dates=[0])

italy_df?=?italy_df[italy_df['Region']?!=?'NA']

cases_df?=?italy_df.iloc[:,:3]
cases_df['Date']?=?cases_df.index
pivoted?=?cases_df.pivot(values='New?positives',index='Date',columns='Region')
pivoted.columns?=?pivoted.columns.astype(str)
pivoted?=?pivoted.rename(columns={'nan':'Unknown?Region'})

cases_gdf?=?pivoted.T
cases_gdf['geometry']?=?cases_gdf.index.map(region_gdf.set_index('NOME_REG')['geometry'].to_dict())

cases_gdf?=?cases_gdf[cases_gdf['geometry'].notna()]

cases_gdf?=?geopandas.GeoDataFrame(cases_gdf,?crs=region_gdf.crs,?geometry=cases_gdf.geometry)

gdf?=?cases_gdf

map_chart?=?gdf.plot_animated(basemap_format={'source':contextily.providers.Stamen.Terrain},cmap='viridis')

cases_df?=?pivoted

from?datetime?import?datetime

bar_chart?=?cases_df.sum(axis=1).plot_animated(
????kind='line',
????label_events={
????????'Schools?Close':datetime.strptime("4/03/2020",?"%d/%m/%Y"),
????????'Phase?I?Lockdown':datetime.strptime("11/03/2020",?"%d/%m/%Y"),
????????'1M?Global?Cases':datetime.strptime("02/04/2020",?"%d/%m/%Y"),
????????'100k?Global?Deaths':datetime.strptime("10/04/2020",?"%d/%m/%Y"),
????????'Manufacturing?Reopens':datetime.strptime("26/04/2020",?"%d/%m/%Y"),
????????'Phase?II?Lockdown':datetime.strptime("4/05/2020",?"%d/%m/%Y"),

????},
????fill_under_line_color="blue",
????add_legend=False
)

map_chart.ax.set_title('Cases?by?Location')

line_chart?=?(
????cases_df.sum(axis=1)
????.cumsum()
????.fillna(0)
????.plot_animated(kind="line",?period_label=False,?title="Cumulative?Total?Cases",add_legend=False)
)


def?current_total(values):
????total?=?values.sum()
????s?=?f'Total?:?{int(total)}'
????return?{'x':?.85,?'y':?.1,?'s':?s,?'ha':?'right',?'size':?11}

race_chart?=?cases_df.cumsum().plot_animated(
????n_visible=5,?title="Cases?by?Region",?period_label=False,period_summary_func=current_total
)

import?time

timestr?=?time.strftime("%d/%m/%Y")

plots?=?[bar_chart,?race_chart,?map_chart,?line_chart]

#?Otherwise?titles?overlap?and?adjust_subplot?does?nothing
from?matplotlib?import?rcParams
from?matplotlib.animation?import?FuncAnimation

rcParams.update({"figure.autolayout":?False})
#?make?sure?figures?are?`Figure()`?instances
figs?=?plt.Figure()
gs?=?figs.add_gridspec(2,?3,?hspace=0.5)
f3_ax1?=?figs.add_subplot(gs[0,?:])
f3_ax1.set_title(bar_chart.title)
bar_chart.ax?=?f3_ax1

f3_ax2?=?figs.add_subplot(gs[1,?0])
f3_ax2.set_title(race_chart.title)
race_chart.ax?=?f3_ax2

f3_ax3?=?figs.add_subplot(gs[1,?1])
f3_ax3.set_title(map_chart.title)
map_chart.ax?=?f3_ax3

f3_ax4?=?figs.add_subplot(gs[1,?2])
f3_ax4.set_title(line_chart.title)
line_chart.ax?=?f3_ax4

axes?=?[f3_ax1,?f3_ax2,?f3_ax3,?f3_ax4]
timestr?=?cases_df.index.max().strftime("%d/%m/%Y")
figs.suptitle(f"Italy?COVID-19?Confirmed?Cases?up?to?{timestr}")

pandas_alive.animate_multiple_plots(
????'examples/italy-covid.gif',
????plots,
????figs,
????enable_progress_bar=True
)
怎么樣,是不是心動(dòng)了,那就快行動(dòng)吧!
原創(chuàng)不易,給個(gè)“在看”再走吧!