
基于K-Means聚類算法的主顏色提取
點擊上方“小白學視覺”,選擇加"星標"或“置頂”
重磅干貨,第一時間送達
01.簡介
02.K均值類聚算法
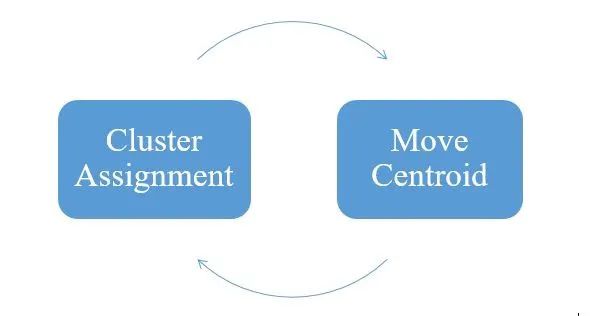
K-Means算法是最流行但最簡單的無監(jiān)督算法。對于散布在n維空間中的所有數(shù)據(jù)點,它會將具有某些相似性的數(shù)據(jù)點歸為一個群集。在隨機初始化k個聚類質(zhì)心之后,該算法迭代執(zhí)行兩個步驟:
1. 聚類分配:根據(jù)每個數(shù)據(jù)點距聚類質(zhì)心的距離,為其分配一個聚類。
2. 移動質(zhì)心:計算聚類所有點的平均值,并將聚類質(zhì)心重定位到平均位置。
根據(jù)新的質(zhì)心位置,將數(shù)據(jù)點重新分配給群集。
K-Means算法的迭代步驟
經(jīng)過一定數(shù)量的迭代后,我們觀察到聚類質(zhì)心不會進一步移動或移動到任何新位置,聚類中的數(shù)據(jù)點也不會更改。至此,算法已經(jīng)收斂。
我們將整個程序分為多個功能,首先導入該程序所需的模塊
import matplotlib.pyplot as pltfrom mpl_toolkits.mplot3d import Axes3Dimport matplotlib.colors as colorimport numpy as npfrom collections import Counterimport pandas as pdimport mathfrom sklearn.cluster import KMeansfrom PIL import Imageimport webcolorsimport jsonimport argparse
在啟動主函數(shù)之前,我們將創(chuàng)建一個ArgumentParser()對象以接受命令行參數(shù),并創(chuàng)建相應的變量以接受命令行參數(shù)的值。與此同時保留了兩個“可選”命令行參數(shù),即clusters和imagepath。
parser = argparse.ArgumentParser()parser.add_argument("--clusters", help="No. of clusters")parser.add_argument("--imagepath", help="Path to input image")args = parser.parse_args()IMG_PATH = args.imagepath if args.imagepath else "images/poster.jpg"CLUSTERS = args.clusters if args.clusters else 5WIDTH = 128HEIGHT = 128
在clusters參數(shù)中,當imagepath用于傳遞帶有圖像名稱的圖像路徑時,您需要提及要從圖像中提取的顏色數(shù)量。默認情況下,程序?qū)膱D像中提取5種顏色,然后從文件夾圖像中選擇一個名為poster.jpg的圖像。小伙伴們可以根據(jù)需要設(shè)置默認值。我們還將為圖像調(diào)整大小定義寬度和高度,然后再從中提取顏色。我將寬度和高度保持為128px。
對于十六進制代碼及其相應的顏色名稱,我使用了JSON文件。顏色名稱及其十六進制代碼的整個詞典已從下面提供的JavaScript文件中獲取:
http : //chir.ag/projects/ntc/ntc.js(JavaScript文件)
http:// chir.ag/projects/ntc/(鏈接到創(chuàng)建者的網(wǎng)站)
我們將在名為color_dict的變量中讀取JSON文件。現(xiàn)在,可以使用此字典變量我們可以直接訪問JSON的鍵值對。
with open('colors.json') as clr:color_dict = json.load(clr)
現(xiàn)在讓我們開始將圖像作為輸入并將其傳遞給K-Means算法。
def TrainKMeans(img):new_width, new_height = calculate_new_size(img)image = img.resize((new_width, new_height), Image.ANTIALIAS)img_array = np.array(image)img_vector = img_array.reshape((img_array.shape[0] * img_array.shape[1], 3))'''----------Training K-Means Clustering Algorithm----------'''kmeans = KMeans(n_clusters = CLUSTERS, random_state=0)labels = kmeans.fit_predict(img_vector)hex_colors = [rgb_to_hex(center) for center in kmeans.cluster_centers_]color_name = {}for c in kmeans.cluster_centers_:h, name = findColorName(c)color_name[h] = nameimg_cor = [[*x] for x in img_vector]'''img_cor is a nested list of all the coordinates (pixel -- RGB value) present in theimage'''cluster_map = pd.DataFrame()cluster_map['position'] = img_corcluster_map['cluster'] = kmeans.labels_cluster_map['x'] = [x[0] for x in cluster_map['position']]cluster_map['y'] = [x[1] for x in cluster_map['position']]cluster_map['z'] = [x[2] for x in cluster_map['position']]cluster_map['color'] = [hex_colors[x] for x in cluster_map['cluster']]cluster_map['color_name'] = [color_name[x] for x in cluster_map['color']]print(cluster_map)return cluster_map, kmeans
如大家所見,上面的函數(shù)“?TrainKMeans?”接受一個圖像文件作為參數(shù)。在第一步中,我們將圖像調(diào)整為我們之前在程序中定義的尺寸,并且使用了自定義函數(shù)來調(diào)整圖像的大小。
def calculate_new_size(image):'''We are resizing the image (one of the dimensions) to 128 px and then, scaling theother dimension with same height by width ratio.'''if image.width >= image.height:wperc = (WIDTH / float(image.width))hsize = int((float(image.height) * float(wperc)))new_width, new_height = WIDTH, hsizeelse:hperc = (HEIGHT / float(image.height))wsize = int((float(image.width) * float(hperc)))new_width, new_height = wsize, HEIGHTreturn new_width, new_height
在自定義大小調(diào)整功能中,我們將圖像的較長尺寸調(diào)整為固定尺寸HEIGHT或WIDTH,并重新調(diào)整了其他尺寸,同時使高度與圖像寬度之比保持恒定。返回TrainKMeans函數(shù),調(diào)整圖像大小后,我將圖像轉(zhuǎn)換為numpy數(shù)組,然后將其重塑為3維矢量以表示下一步的RGB值。
現(xiàn)在,我們準備在圖像中創(chuàng)建顏色簇。使用KMeans()函數(shù),我們可以創(chuàng)建群集,其中超參數(shù)n_clusters設(shè)置為clusters,在程序開始時我們接受的命令行參數(shù),而random_state等于零。接下來,我們將為輸入圖像文件擬合模型并預測聚類。使用聚類中心(RGB值),我們可以找到聚類代表的相應顏色的十六進制代碼,為此使用了rgb_to_hex的自定義函數(shù)。
def rgb_to_hex(rgb):'''Converting our rgb value to hex code.'''hex = color.to_hex([int(rgb[0])/255, int(rgb[1])/255, int(rgb[2])/255])print(hex)return hex
這是一個非常簡單的函數(shù),它使用matplotlib.colors的to_hex函數(shù)。我們已經(jīng)將RGB值標準化為0到1的范圍,然后將它們轉(zhuǎn)換為各自的十六進制代碼。現(xiàn)在,我們有了每個顏色簇的十六進制代碼。
在下一步中,我們將使用findColorName()函數(shù)查找每種顏色的名稱。
def findColorName(rgb):'''Finding color name :: returning hex code and nearest/actual color name'''aname, cname = get_colour_name((int(rgb[0]), int(rgb[1]), int(rgb[2])))hex = color.to_hex([int(rgb[0])/255, int(rgb[1])/255, int(rgb[2])/255])if aname is None:name = cnameelse:name = anamereturn hex, namedef closest_colour(requested_colour):'''We are basically calculating euclidean distance between our set of RGB valueswith all the RGB values that are present in our JSON. After that, we are lookingat the combination RGB (from JSON) that is at least distance from inputRGB values, hence finding the closest color name.'''min_colors = {}for key, name in color_dict['color_names'].items():r_c, g_c, b_c = webcolors.hex_to_rgb("#"+key)rd = (r_c - requested_colour[0]) ** 2gd = (g_c - requested_colour[1]) ** 2bd = (b_c - requested_colour[2]) ** 2min_colors[math.sqrt(rd + gd + bd)] = name#print(min(min_colours.keys()))return min_colors[min(min_colors.keys())]def get_colour_name(requested_colour):'''In this function, we are converting our RGB set to color name using a thirdparty module "webcolors".RGB set -> Hex Code -> Color NameBy default, it looks in CSS3 colors list (which is the best). If it cannot findhex code in CSS3 colors list, it raises a ValueError which we are handlingusing our own function in which we are finding the closest color to the inputRGB set.'''try:closest_name = actual_name = webcolors.rgb_to_name(requested_colour)except ValueError:closest_name = closest_colour(requested_colour)actual_name = Nonereturn actual_name, closest_name
在findColorName函數(shù)中,我們調(diào)用了另一個名為get_color_name()的自定義函數(shù),該函數(shù)返回兩個值,即aname(實際名稱)和cname(最近的顏色名稱)。
在此功能中,使用第三方模塊webcolors將RGB轉(zhuǎn)換為顏色名稱。默認情況下,webcolors函數(shù)在CSS3顏色列表中查找。如果無法在其列表中找到顏色,則會引發(fā)ValueError,這時使用另一個名為closest_colour()的自定義函數(shù)處理的。在此函數(shù)中,我正在計算輸入RGB值與JSON中存在的所有RGB值之間的歐式距離。然后,選擇并返回距輸入RGB值最小距離的顏色。
在TrainKMeans()函數(shù)中創(chuàng)建的十六進制代碼字典及其各自的名稱。然后使用img_vector創(chuàng)建了圖像中存在的所有RGB點的列表。接下來將初始化一個空的數(shù)據(jù)框cluster_map,并創(chuàng)建一個名為position的列,該列保存圖像和列簇中存在的每個數(shù)據(jù)點(像素)的RGB值,我存儲了每個數(shù)據(jù)點(像素)被分組到的簇號。然后,在color和color_name列中,我為圖像的每個像素存儲了十六進制代碼及其各自的顏色名稱。最后,我們返回了cluster_map數(shù)據(jù)框和kmeans對象。
def plotColorClusters(img):cluster_map, kmeans = TrainKMeans(img)fig = plt.figure()ax = Axes3D(fig)# grouping the data by color hex code and color name to find the total count of# pixels (data points) in a particular clustermydf = cluster_map.groupby(['color', 'color_name']).agg({'position':'count'}).reset_index().rename(columns={"position":"count"})mydf['Percentage'] = round((mydf['count']/mydf['count'].sum())*100, 1)print(mydf)# Plotting a scatter plot for all the clusters and their respective colorsax.scatter(cluster_map['x'], cluster_map['y'], cluster_map['z'], color = cluster_map['color'])plt.show()'''Subplots with image and a pie chart representing the share of each color identifiedin the entire photograph/image.'''plt.figure(figsize=(14, 8))plt.subplot(221)plt.imshow(img)plt.axis('off')plt.subplot(222)plt.pie(mydf['count'], labels=mydf['color_name'], colors=mydf['color'], autopct='%1.1f%%', startangle=90)plt.axis('equal')plt.show()def main():img = Image.open(IMG_PATH)plotColorClusters(img)
最后使用散點圖繪制了3D空間中圖像的每個數(shù)據(jù)點(像素),并在圖像中標識了顏色,并使用餅圖顯示了圖像的顏色分布。
項目代碼:https://github.com/nandinib1999/DominantColors
交流群
歡迎加入公眾號讀者群一起和同行交流,目前有SLAM、三維視覺、傳感器、自動駕駛、計算攝影、檢測、分割、識別、醫(yī)學影像、GAN、算法競賽等微信群(以后會逐漸細分),請掃描下面微信號加群,備注:”昵稱+學校/公司+研究方向“,例如:”張三?+?上海交大?+?視覺SLAM“。請按照格式備注,否則不予通過。添加成功后會根據(jù)研究方向邀請進入相關(guān)微信群。請勿在群內(nèi)發(fā)送廣告,否則會請出群,謝謝理解~